For a detailed analysis of this example process using the above SuperPro Designer files, please refer to the ‘Synpharm.doc’ readme file that can be found in the same directory as the SuperPro Designer files.
This example analyzes the production of a synthetic pharmaceutical intermediate, which is formed by condensation of quinaldine and hydroquinone. The objective is to demonstrate how SuperPro Designer can be used as a tool to assist with scaling up the available pilot plant process into a large-scale process and maximize capacity using the available equipment at the lowest possible cost. This example is recommended for users in the pharmaceutical, agrochemical, and specialty chemical industries. Please, see Process Description for more details on this process.
The process file and readme files for this example can be found in the ‘Examples\Pharmaceuticals\SynPharm’ directory of SuperPro Designer. The following process files demonstrate equipment sharing within a process and scaling-up of a process:
1. SynPharma_v10a: This file represents an existing pilot plant process, which will act as the starting point for the scale-up process. The equipment sizes reflect a pilot plant environment. Four main pieces of equipment are used to carry out the process: two reactors named ‘R-101’ and ‘R-102’ (1200 L each), a Nutsche filter named ‘NFD-101’ (1 m2 filter area), and a tray dryer named ‘TDR-101’ (3 m2 tray area). There is also a storage bin named ‘SB-101’ which is not considered to be limiting the process in any way due to its low cost. This file demonstrates how to specify process sections and also, how to specify equipment sharing and visualize that through the equipment occupancy chart (see Viewing Scheduling, Equipment Utilization and Resource Tracking Results).
2. SynPharma_v10b: In this file, large-scale equipment is used while the process is still at the pilot plant scale.
3. SynPharma_v10c: This file is based on the previous one. The process is scaled up to maximum batch size based on the limit imposed by equipment resource ‘NFD-101’ utilized by procedure ‘P-3’, and, more specifically, by the depth of the filter cake.
Once the process is scaled up, several strategies are evaluated on how to increase the process throughput. The following SuperPro Designer files analyze the strategies implemented in this case and demonstrate how to access the pertinent SuperPro Designer features in order to perform a similar exercise:
4. SynPharma_v10d: This file demonstrates how to eliminate an equipment size bottleneck (an equipment resource that limits the batch size of the process) by increasing its time utilization. In this case, equipment ‘NFD-101’ utilized by procedure ‘P-3’ is the size bottleneck (imposed by the depth of its cake) but it is underutilized in time. By increasing the number of cycles per batch for procedure ‘P-3’ from 1 to 2, shifts the size bottleneck to equipment ‘R-102’ utilized by procedure ‘P-10’. Equipment ‘R-102’ is also the scheduling bottleneck (an equipment resource that limits the annual number of batches) in this example. This can be noted by viewing the equipment occupancy chart (see Viewing Scheduling, Equipment Utilization and Resource Tracking Results).
5. SynPharma_v10e: It was mentioned in the previous file that the new size and time bottleneck is equipment ‘R-102’. In this file, an extra reactor is added to eliminate that bottleneck. As a consequence, the number of batches performed annually is increased and the scheduling bottleneck shifts to equipment ‘NFD-101’. The above can be easily viewed with the help of the equipment occupancy chart (see Viewing Scheduling, Equipment Utilization and Resource Tracking Results).
6. SynPharma_v10f: Another filter is added in the same manner to the previous file to eliminate the new scheduling bottleneck and the annual number of batches is increased.
7. SynPharma_v10g: This case is not as straightforward as the previous ones. It can be noted by looking at the utilization factors chart (see Throughput Analysis and Debottlenecking) for the previous file that equipment resource ‘R-103’ utilized by procedure ‘P-10’ is the size bottleneck, while all other procedure/equipment combinations have modest size utilizations. In this case, the batch is split in two halves starting with procedure ‘P-10’. That enables us to increase the batch size, but the number of batches per year drops. However, the increase in batch size overcompensates for the reduction in the number of batches.
|
|
For a detailed analysis of this example process using the above SuperPro Designer files, please refer to the ‘Synpharm.doc’ readme file that can be found in the same directory as the SuperPro Designer files. |
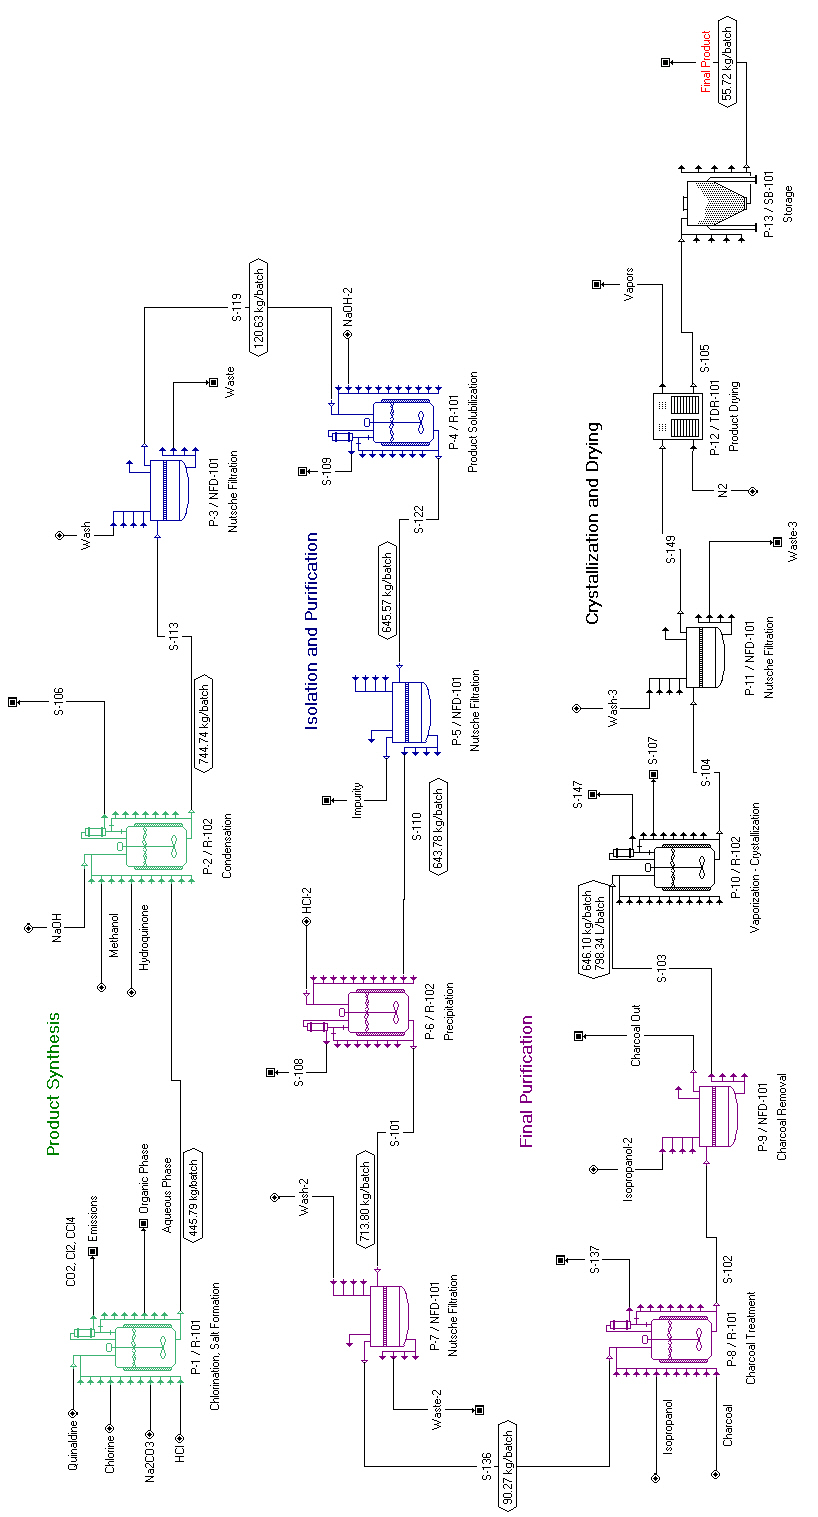
The description that follows refers to file SynPharma_v10a. Please open this file now. The corresponding flowsheet for this file is shown in The process flowsheet for the synthesis of a pharmaceutical intermediate compound.. The following equipment is available:
● two Stirred Reactor (CSTR) vessels (‘R-101’ and ‘R-102’) each having a total volume of 1200 L,
● a Nutsche Filter (‘NFD-101’) with an area of 1 m2,
● a Tray Dryer (‘TDR-101’) with a total tray area of 3 m2, and
● a Solids Bin (‘SB-101’) of 82 L.
The generation of the process simulation was based on information available in the patent and technical literature. Several reaction and separation steps are required to synthesize and purify the product of this process. These steps are described below:
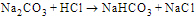
Unit procedure ‘P-1’ (a Batch Vessel Procedure in a Reactor) takes place in reactor ‘R-101’ and involves two reaction steps. The first reaction step (see Batch Stoichiometric Reaction operation named ‘Chlorination Rxn’) involves the chlorination of quinaldine. Quinaldine is dissolved in carbon tetrachloride (CCl4) and reacts with gaseous Cl2. The yield of the reaction is around 98% (see ‘Reactions’ tab for this operation). The generated HCl is neutralized using Na2CO3. The stoichiometry and yield data of the three reactions are as follows:
|
|
Yield = 98% |
:
|
|
Yield = 100% |
|
|
Yield = 100% |
Small amounts of unreacted Cl2, generated CO2, and gaseous CCl4 are vented. The above three reactions occur sequentially in ‘P-1’.
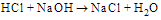
The second reaction step (see Batch Stoichiometric Reaction operation named ‘Salt Formation’) involves the formation of chloroquinaldine.HCl salt. The added HCl first neutralizes the remaining NaHCO3 and then reacts with chloroquinaldine to form its salt. The stoichiometry and yield of the two reactions are as follows:
|
|
Yield = 100% |
|
|
Yield = 100% |
Small amounts of generated CO2 and gaseous CCl4 are vented. The presence of water (added with HCl as hydrochloric acid solution) and CCl4 leads to the formation of two liquid phases. The small amounts of unreacted quinaldine and chloroquinaldine remain in the organic phase while the salts chloroquinaldine.HCl and NaCl move to the aqueous phase. After the reaction, the contents are allowed to settle, and the aqueous phase is transferred to reactor ‘R-102’ for further processing (see Batch Extraction / Phase Split operation named ‘Transfer Aqueous Phase’). The organic phase is then discharged as waste (see Transfer Out operation named ‘Dispose Organic’). Approximately 11.3 hours are required for the chlorination and salt formation reactions above, along with all associated charges and transfers (note that the times given for other procedures below will also include associated material transfers, etc.). This is the cycle time for ‘P-1’. This information is available in the ‘Scheduling’ tab of the simulation data dialog for this procedure. To open this dialog, right-click on the procedure icon and select Procedure Data.
Unit procedure ‘P-2’ (a Batch Vessel Procedure in a Reactor) takes place in reactor ‘R-102’ and involves the condensation of chloroquinaldine and hydroquinone (see Batch Stoichiometric Reaction operation named ‘Condensation Rxn’). First, the salt chloroquinaldine.HCl is converted back to chloroquinaldine using NaOH. Then, hydroquinone reacts with NaOH and yields hydroquinone.Na. Finally, chloroquinaldine and hydroquinone.Na react and yield the desired intermediate product. Along with product formation, a small amount of chloroquinaldine dimerizes and forms an undesirable by-product (pure component named ‘Impurity’) that needs to be removed from the product. The stoichiometry and yield of the four reactions are as follows:
|
|
Yield = 100% |
|
|
Yield = 2% |
|
|
Yield = 100% |
:
|
|
Yield = 100% |
This step takes a total of approximately 11 hours.
Unit procedure ‘P-3’ (a Nutsche Filtration Procedure) takes place in Nutsche filter ‘NFD-101’ and involves product recovery. Both the product and impurity molecules formed during the condensation reaction precipitate out of solution and are recovered using a Nutsche filter (see Cloth Filtration operation named ‘Product Isolation’). The product recovery yield is 90%. The total filtration and cake discharge time (i.e., the procedure cycle time) is 4.9 hours assuming an average filtrate flux of 200 L/m2-h.
Unit procedure ‘P-4’ (a Batch Vessel Procedure in a Reactor) takes place in reactor ‘R-101’ and involves a solubilization reaction step. The product/impurity cake recovered by filtration is added into a NaOH solution. The product molecules react with NaOH forming product.Na (see Batch Stoichiometric Reaction operation named ‘Product Solubilization’) which is soluble in water. The Impurity molecules remain in solid phase. The stoichiometry and yield of the solubilization reaction follows:
|
|
Yield = 100% |
This step takes a total of approximately 6.9 hours.
Next, the impurity is removed using another filtration step that takes place in Nutsche filter ‘NFD-101’. The total time for filtration, cake wash and cake discharge is around 3.2 hours using an average filtrate flux of 200 L/m2-h.
Unit procedure ‘P-6’ (a Batch Vessel Procedure in a Reactor) takes place in reactor ‘R-102’ and involves a precipitation reaction step. The excess NaOH is neutralized using HCl and then product.Na is converted back to product (see Batch Stoichiometric Reaction operation named ‘Precipitation Rxn’). The stoichiometry and yield of the two reactions are as follows:
|
|
Yield = 100% |
|
|
Yield = 100% |
The product, which is insoluble in water, precipitates out of solution. This step takes around 9.2 hours.
The process flowsheet for the synthesis of a pharmaceutical intermediate compound.
Next, the product is recovered using another filtration step that takes place in Nutsche filter ‘NFD-101’. The product cake is washed with water to remove impurities. The product recovery yield is 90%. The total time for filtration and cake discharge is around 4.4 hours using an average filtrate flux of 200 L/m2-h.
Unit procedure ‘P-8’ (a Batch Vessel Procedure in a Reactor) takes place in reactor ‘R-101’ and involves charcoal treatment of the product cake. The recovered product cake is dissolved in isopropanol and treated with charcoal for removal of colorants. This step takes a total of approximately 13.5 hours.
After charcoal treatment, the carbon particles are removed using another filtration step that takes place in Nutsche filter ‘NFD-101’. The total time for filtration and cake discharge is around 4 hours using an average filtrate flux of 200 L/m2-h.
Unit procedure ‘P-10’ (a Batch Vessel Procedure in a Reactor) takes place in reactor ‘R-102’ and involves two steps. First, the product solution is concentrated by vaporizing isopropanol (see Batch Vaporization / Solvent Switch operation named ‘VAPORIZE-1’). During vaporization, the maximum working-to-vessel volume ratio is set to 70% (which also determines the size of the equipment). The reason behind this is the volume expansion that needs to be accounted for due to the gas formation. Vaporization operations generally require a lower working-to-vessel volume ratio than reaction operations. The 70% working-to-vessel volume ratio is used in all SuperPro Designer files included with this example. After vaporization, the product is crystallized with a yield of 97% (see Batch Stoichiometric Reaction operation named ‘Crystallization’). Crystallization is represented by the following reaction:.
|
|
Yield = 97% |
In other words, a new component (‘Product-Cryst’) is used to represent the crystalline form of product. This step is performed in approximately 10.9 hours.
The crystalline product is recovered using another filtration step that takes place in Nutsche filter ‘NFD-101’ with a yield of 90%. The total time for filtration and cake discharge is around 2.8 hours using an average filtrate flux of 200 L/m2-h.
In unit procedure ‘P-12’ (a Tray Drying Procedure), the recovered product crystals are dried in a tray dryer (‘TDR-101’). The drying takes around 15.4 hours. Approximately 55.7 kg of dried product is produced per batch.
Finally, the dried process material is stored in a storage bin (‘SB-101’) during unit procedure ‘P-13’ (a Batch Storage in a Bin (for Bulk Solids) Procedure).
A process section is a group of processing steps that have something in common. Many economic factors in SuperPro Designer are section-dependent and that is one reason to break-up your process into more than one sections. The process of this example was divided into four sections:
1. ‘Product Synthesis’ (green icons),
2. ‘Isolation and Purification’ (blue icons),
3. ‘Final Purification’ (purple icons), and
4. ‘Crystallization and Drying’ (black icons).
To create a new section, click New Section ( ) on the Section toolbar.
To add unit procedures to a specific section, first select the desired section in the ‘Section Names’ drop-down list that can be found on the ‘Section’ toolbar. Then, highlight the desired unit procedure icons on the flowsheet (use Ctrl+Click to add/remove unit procedures to/from the selection set) and click Add to Section ( ) on the same toolbar.
To rename the selected section, click Rename Section ( ) on the Section toolbar. To delete it, click Delete Section (
 ) on the same toolbar. To access or modify the properties of a section (e.g., the color of unit procedure icons), click Edit Section Properties (
 ) on the Section toolbar, or Process Options } Section: <section name> } Properties on the Edit menu (note that the term in brackets denotes the name of a selected section). This will bring up the properties dialog for the selected section. If you click on the ‘Icon Color’ tab of this dialog, you can edit the section’s default unit procedure icon color.
Another reason to break-up a process in two or more sections is that you can allocate sections to different physical sites declared in the Sites and Resources databank (contained in the ‘User’ database) and thus make use of equipment and resources of specific sites. To use this feature, you will first need to declare the sites in the databank by selecting Sites and Resources on the Databanks menu. Through the dialog that comes up, you are able to define new sites in a parent-child hierarchy (i.e. sites with their sub-sites or facilities) and declare their equipment, utility and labor resources as well as site-related economic data (see Allocation and Sites & Resources Databank for details).
► To allocate a section to a site...
1. Select the desired section in the ‘Section Names’ drop-down list of the Section toolbar.
2. Click Edit Section Properties ( ) on the Section toolbar.
3. In the ‘Allocation’ tab, select the ‘Allocated to database site’ option, and then select the desired site from the drop-down tree that is available next to that option.
4. Click OK to close the dialog.
Once you allocate a section to a database site, you can allocate equipment of that section to site equipment and also make use within each operation of site utilities and labor.
|
|
For more information on how to allocate sections and equipment to database entities, please consult the ‘SynPharmDB.doc’ readme file that can be found in the ‘Examples\SynPharm’ directory of SuperPro Designer. See also Allocation and Sites & Resources Databank. |
Following the instructions in the readme file and in Allocation and Sites & Resources Databank, you might want to go through the exercise of declaring a new site in the Sites & Resources databank and allocating one or more sections of this example to that site.
In the section properties dialog, you can also define and see the ‘Starting Material’ and ‘Active Product’ for a section along with the calculated yields. If you go to the ‘Yields’ tab, you can see the molar yield for each section. In this example, the molar yields of the ‘Product Synthesis’, ‘Isolation and Purification’, ‘Final Purification’, and ‘Crystallization and Drying’ sections are 93.9%, 89.9%, 90.0%, and 87.3%, respectively.
For more details on process sections, see Sections & Branches or consult the Help documentation (look up the keyword ‘Sections’ in the Help index).
It is important to understand that when you model batch processes in SuperPro Designer, the flowsheet depicts a representation of processing steps (unit procedures) and not a representation of equipment. This is the case because in a batch plant, it is common to utilize the same piece of equipment for carrying out multiple processing steps. In this example, for instance, the ‘Chlorination, Salt Formation’ (‘P-1’), ‘Product Solubilization’ (‘P-4’) and ‘Charcoal Treatment’ (‘P-8’) steps share reactor ‘R-101’. The ‘Condensation’ (‘P-2’), ‘Precipitation’ (‘P-6’), and ‘Vaporization - Crystallization’ (‘P-10’) steps share reactor ‘R-102’. Finally, all five filtration steps (‘P-3’, ‘P-5’, ‘P-7’, ‘P-9’, and ‘P-11’) utilize the same Nutsche filter (‘NFD-101’). Notice that a shared equipment indicator ( ) is shown at the bottom left corner of the corresponding unit procedure icons to indicate that the above steps use shared equipment.
By default, whenever a unit procedure is introduced in the process, the system assumes that the procedure is carried out in its own piece of equipment. However, you also have the option of selecting one of the existing equipment items that are compatible with this procedure through the ‘Equipment’ tab of the ‘Equipment Data’ dialog (right-click on a unit procedure icon and select Equipment Data).
The ‘Equipment’ tab of the ‘Equipment Data’ dialog for unit procedure ‘P-4’. displays the ‘Equipment’ tab for procedure ‘P-4’. Instead of using a unique vessel for this procedure, the user decided to reuse ‘R-101’, which also handles procedure ‘P-1’. Please note that if the processing times of two procedures that share the same equipment overlap in time, SuperPro Designer will generate a warning. Also note that equipment sharing is available in equipment ‘Design Mode’ as well as ‘Rating Mode’. Equipment sharing is also implied when two or more unit procedures use equipment allocated to the same site equipment. The site-equipment databank, therefore, provides you the means to declare that the same equipment is used for multiple tasks not only in the same recipe but across recipes as well.
When multiple unit procedures share a piece of equipment in ‘Design Mode’ (unspecified size), each procedure recommends its own sizing to achieve the necessary throughput and SuperPro Designer selects the maximum. For each unit procedure, if the calculated equipment size to achieve the necessary throughput exceeds the user-defined maximum size specification, then SuperPro Designer assumes multiple equipment items of the same size so that:
● the equipment size is smaller than or equal to the maximum size specification, and
● the total size of all equipment items is equal to the calculated total size requirement.
For example, if a maximum size of 5 m2 is specified in ‘Design Mode’ for Nutsche filter ‘NFD-101’, and your process requires 12 m2 of filter area to achieve the necessary throughput, three 4 m2 filters will be used by SuperPro Designer.
In ‘Rating Mode’, the user specifies the equipment size as well as the number of equipment items employed by a unit procedure. In other words, in SuperPro Designer a single unit procedure icon may correspond to multiple equipment items that operate in parallel, or multiple unit procedure icons may correspond to a single piece of equipment (if the plant operation mode is batch and those procedures share equipment).
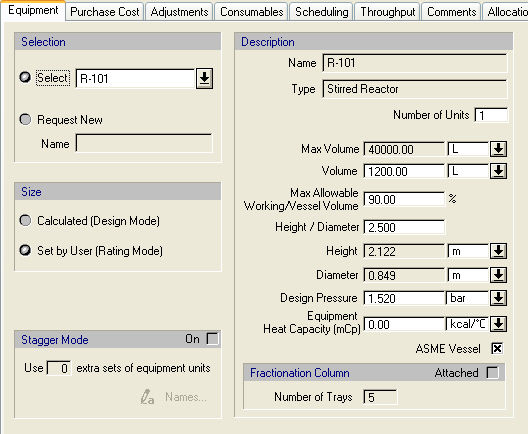
The ‘Equipment’ tab of the ‘Equipment Data’ dialog for unit procedure ‘P-4’.
When the equipment is allocated to a site equipment, its size specification mode is set by default to ‘Rating Mode’ and the ‘Design Mode’ option is deactivated. In addition, all data specifications are copied from the site equipment and become non-editable. This signifies the fact that the equipment shown in the recipe is actually the one declared in the site databank and has therefore fixed specifications that cannot be changed unless you visit the site databank and change the specifications of the site equipment.
Equipment sharing reduces the number of equipment items required for a batch process and, consequently, saves money in terms of capital expenditures. However, it also introduces scheduling constraints that may reduce the number of batches that can be processed per year. For information on how to visualize equipment sharing, see Process Analysis. For detailed information on the impact of equipment sharing on plant throughput, please consult Chapter 11 (Debottlenecking) or look up the keyword ‘debottlenecking’ in the Help documentation.
Batch reactions constitute the most common operation in synthetic pharmaceutical processes. SuperPro Designer is equipped with three different batch reaction operation models:
● Batch Stoichiometric Reaction,
● Batch Kinetic Reaction, and
The stoichiometric is used if no kinetic and equilibrium data are available. If kinetic data are available, the kinetic model can be used to calculate composition, temperature, and utility profiles as a function of time. All reaction operations share the same ‘Oper. Cond’s’ tab (see The ‘Oper.Cond’s’ tab for the chlorination reaction operation i n procedure ‘P-1’.) through which the user can specify the duration of the operation, the thermal mode, the power consumption, etc.
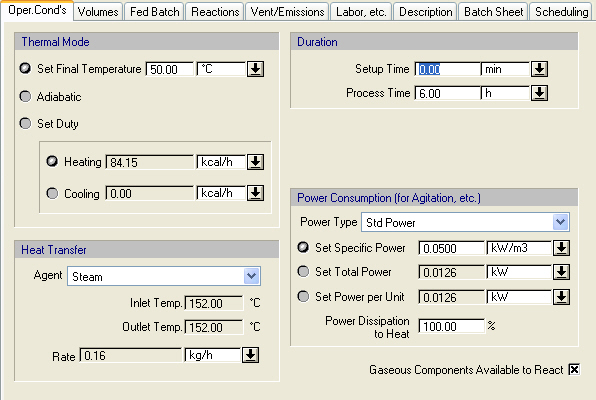
The ‘Oper.Cond’s’ tab for the chlorination reaction operation i n procedure ‘P-1’.
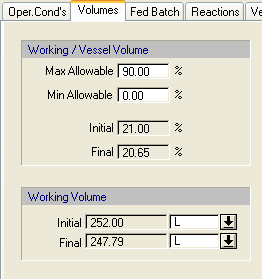
Similarly, all reaction operations share the same ‘Volumes’ tab (see The ‘Volumes’ tab for the chlorination reaction operation i n procedure ‘P-1’.). In equipment ‘Design Mode’ (equipment size is unspecified), the maximum allowable working-to-vessel volume (%) specification is used for sizing the vessel. If multiple operations in the same unit procedure require different equipment capacities, the maximum capacity requirement of these operations is selected as the equipment size. In equipment ‘Rating Mode’ (equipment size is specified), the maximum allowable working-to-vessel volume (%) specification acts as a constraint and SuperPro Designer generates a warning when it is violated. The maximum allowable working-to-vessel volume (%) specification also acts as a constraint. The same logic applies to other vessel operations
.
The ‘Volumes’ tab for the chlorination reaction operation i n procedure ‘P-1’.
All batch reactions also have fed-batch capability for supply of additional reactants during the reaction operation. This is common practice in cases of highly exothermic reactions. Slow addition of one of the reactants controls the reaction rate and the need for cooling. Fed-batch operation is also common in bioprocessing to maintain a certain level of media concentration during fermentation.
|
|
For an example of a fed-batch reaction model, please consult example ‘FedBR’ in the ‘Examples\Misc’ directory of SuperPro Designer. |
The ‘Reactions’ tab for the chlorination reaction operation i n procedure ‘P-1’. displays the ‘Reactions’ tab of a Batch Stoichiometric Reaction operation (in this case, ‘Chlorination Rxn’ in ‘P-1’). Through this tab, the user specifies the stoichiometry and other data associated with the various reactions in this operation. Please note that a reaction operation can handle any number of reactions. The stoichiometry of a reaction is specified by selecting a reaction and clicking Edit Stoichiometry ( ). The ‘Extent’ of a stoichiometric reaction represents the fractional conversion of its limiting component. By default, the limiting component is identified by the model based on the stoichiometric coefficients and the feed composition. The user has the option to specify a reference component for the extent of reaction. In that case, if the specified reaction extent is not feasible, the model adjusts its value to the maximum possible. The user also has the option to specify the desired final concentration of a reactant or product and have the model estimate the extent of reaction. If the specified concentration is not feasible, the model adjusts its value to the maximum (or minimum) possible.
Several different methods can be used to specify multiple reactions within a single reaction operation. For instance, each reaction could be written individually, as was done for the ‘Chlorination’ and ‘HCl Neutralization’ reactions in The ‘Reactions’ tab for the chlorination reaction operation i n procedure ‘P-1’.. The ‘S’ in the first column of the ‘Reaction Sequence’ listing indicates that the reactions take place sequentially (as opposed to ‘P’ for parallel reactions). In other words, first the ‘Chlorination’ reaction proceeds to its specified reaction extent. Then, the first ‘HCl Neutralization’ reaction proceeds to its specified reaction extent. Finally, the second ‘HCl Neutralization’ reaction occurs. In other situations, you may wish to specify reactions that occur simultaneously. You can do this by clicking on the ‘Parallel ?’ check box for each reaction. In this case, the specified reaction extent for each reaction is applied to the material amounts as existing at the beginning of the parallel set of reactions. Note that you can have both sequential reaction steps and parallel groups of reactions in the ‘Reaction Sequence’ listing.
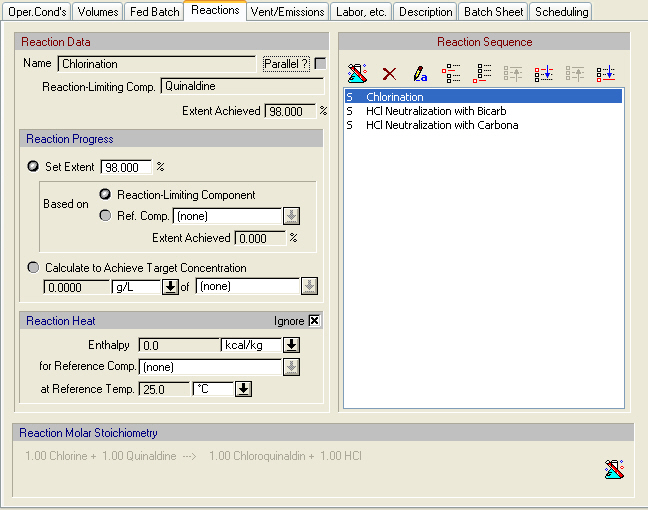
The ‘Reactions’ tab for the chlorination reaction operation i n procedure ‘P-1’.
The ‘Reactions’ tabs of batch kinetic or equilibrium reactions is quite similar to that of The ‘Reactions’ tab for the chlorination reaction operation i n procedure ‘P-1’.. The main difference is that instead of specifying the reaction extent, it has a button through which the user can bring up the kinetic data dialog for a reaction. Through this dialog, the user specifies the kinetics of a reaction. Furthermore, clicking on the ‘Start/End Criteria’ buttons brings up other dialogs through which the user can specify when or under what conditions a reaction is initiated or terminated. For more information on kinetic reactions, please consult examples ‘BKinRxn’, ‘BKinFerm’ and ‘FedBR’ in the ‘Examples\Misc’ directory of SuperPro Designer.
At this point, you may return to the synthetic pharmaceutical example. Do not hesitate to change the values of certain parameters and redo the mass and energy balance calculations (click Solve ME Balances ( ) on the Main toolbar or on the Tasks menu, or simply hit Ctrl+3 or F9 on your keyboard).
You can view the calculated flowrate and composition of intermediate and output streams by visiting the simulation data dialog of each stream (double click on a stream, or right-click on a stream and select Simulation Data). Alternatively, you may use the ‘Stream Summary Table’ to view selected attributes (e.g., total flow, temperature and pressure) of selected streams. To show or hide the ‘Stream Summary Table’, click Stream Summary Table ( ) on the Main toolbar. Stream summary table displayed on the flowsheet. displays a portion of that table for this example.
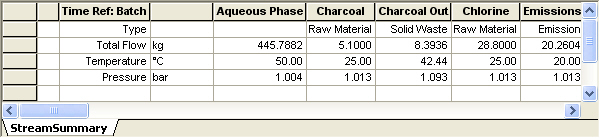
Stream summary table displayed on the flowsheet.
Note that the ‘Stream Summary Table’ is empty when it is brought up the first time. To populate it, right-click on the table to bring up its context menu and select Edit Contents. This will bring up the ‘Contents Selection’ dialog, which allows you to specify which streams and stream attributes to monitor. You also have the option to exclude certain components from the list by clicking Include / Exclude Components ( ). In the table, you can choose different physical units for stream attributes by clicking on the physical units cells. The table can be floated by right-clicking on it to and checking the Dock option on the table’s context menu. Also, the table has printing capabilities and can be easily exported to Excel. To print the table along with the flowsheet, the Dock and Include in Printing options on the table’s context menu must be checked.
You may also generate the ‘Streams & Material Balance (SR)’ report by clicking Streams & Mat. Balance (SR) on the Reports menu. This report contains information on the overall process, raw material requirements, stream compositions and flowrates, as well as an overall material balance. You may customize the format and contents of this report through the ‘Report Options’ dialog. To open this dialog, select Options on the Reports menu. Please generate and view the ‘Streams & Material Balance (SR)’ report for this example now.
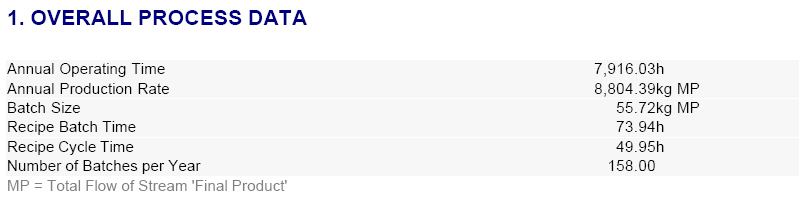
The overall process data table of the Streams & Material Balance (SR) report. shows the overall process data table of the SR report for this example. MP stands for main product and it refers to the final dried crystals. It can be seen that around 55.7 kg of final dried crystals are produced per batch in this example. Also, the overall batch time (from start to finish of a single batch) is approximately 74 hours, whereas the time between two consecutive batch starts (the recipe cycle time) is approximately 50 hours.
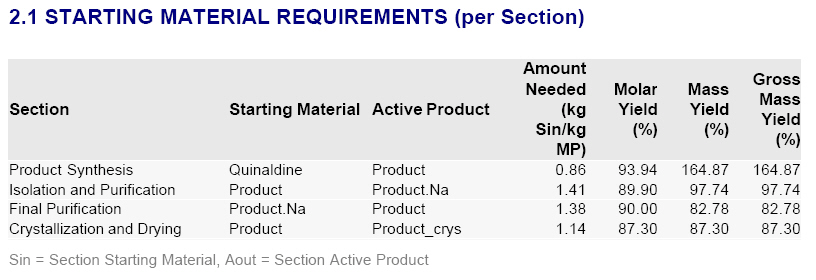
Another table of the SR report is the starting material requirements table which is shown in The starting material requirements table of the Streams & Material Balance (SR) report. for this process. The starting material and active product listed in this table for each section, are specified through the ‘Yields’ tab of a section’s properties dialog. To view this dialog, first select the desired section in the ‘Section Names’ drop-down list that is available on the Section toolbar, and then click Edit Section Properties ( ) on the same toolbar.
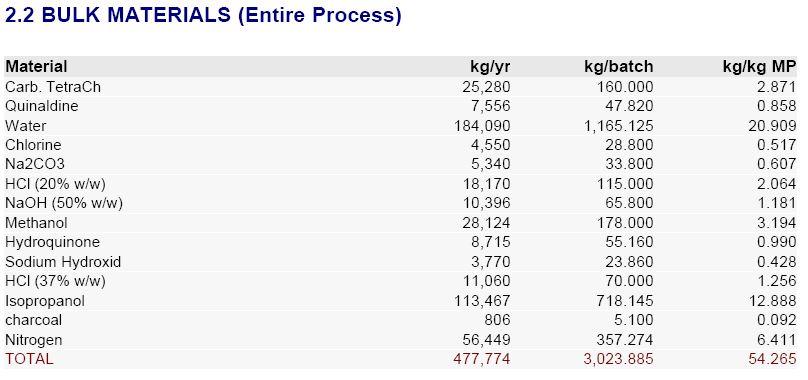
Also, the bulk materials table of the SR report for this process is shown in The bulk material s table of the Streams & Material Balance (SR) report.. This table provides information on raw material requirements for the entire process. Note that around 54.3 kg of materials (solvents, reagents, etc) are used per kg of main product produced in this example. Thus, the product-to-raw material ratio is only 2%, which indicates that this process generates large amounts of waste; for more details on the SR report, see MateriaLS & Stream Report (SR).
The overall process data table of the Streams & Material Balance (SR) report.
The starting material requirements table of the Streams & Material Balance (SR) report.
The bulk material s table of the Streams & Material Balance (SR) report.
The detailed equipment contents during a processing step can be viewed by right-clicking on a desired unit procedure and selecting Equipment Contents } During <procedure name> on the context menu of that procedure. Selecting Procedure Activity Overview on the same menu displays related information; for more details on viewing simulation results, see Switching Unit Procedures.
SuperPro Designer generates the Operations Gantt Chart and the Equipment Gantt Chart that display scheduling and equipment utilization information, respectively, for single or multiple batches. From the Gantt chart interfaces, you can also modify the scheduling parameters of unit procedures, operations, equipment (in Equipment Gantt Charts only), as well as of the entire recipe, and immediately visualize the effects on the entire batch production. A portion of the Operations Gantt Chart for this example and for a single batch is shown in The Operations Gantt Chart for a single batch..
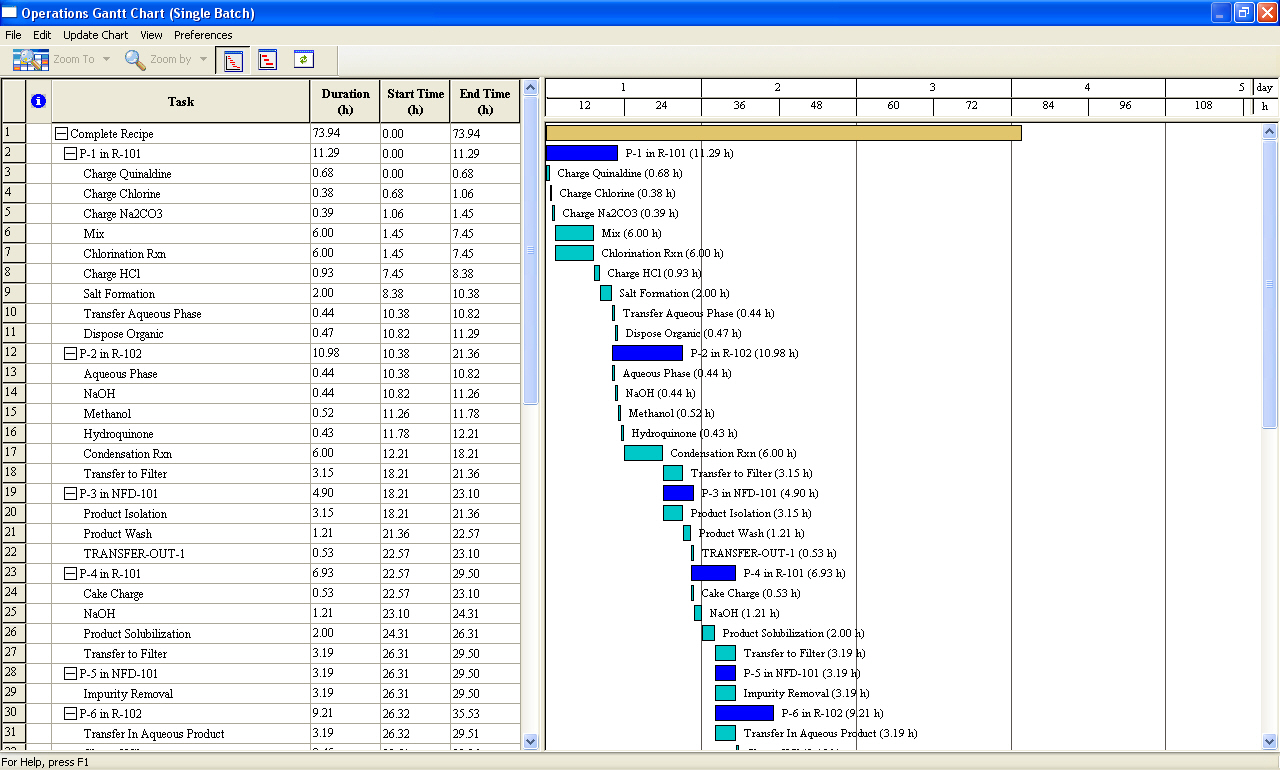
The Operations Gantt Chart for a single batch.
Another way of visualizing the execution of a batch process as a function of time is through the Equipment Occupancy Chart. This chart shows in a graphical way how long each equipment is kept busy by some operation and how long it is just idle during batch processing. The Equipment Occupancy Chart for two consecutive batches of this example process is shown in The Equipment Occupancy Chart for two consecutive batches.. Please generate this chart now. To view scheduling summary information for this process on the chart (as was done in The Equipment Occupancy Chart for two consecutive batches.), right-click on the chart to bring up its context menu and check Scheduling Summary. You may also access or modify the recipe scheduling information by selecting Edit Recipe Scheduling Info on the same menu.
As shown in this chart, Equipment ‘R-101’ is utilized by three different unit procedures (‘P-1’, ‘P-4’, and ‘P-8’) within a batch and some idle time exists between these procedures. This is indicated by the three blocks of the same color shown on the bar line of equipment ‘R-101’. Each rectangle in a block represents a single operation. Placing the mouse pointer over a bar displays the corresponding operation name and unit procedure name carried out in the host equipment at that time. Equipment items ‘R-102’ and ‘NFD-101’ also handle multiple processing steps (unit procedures) within a batch in this example.
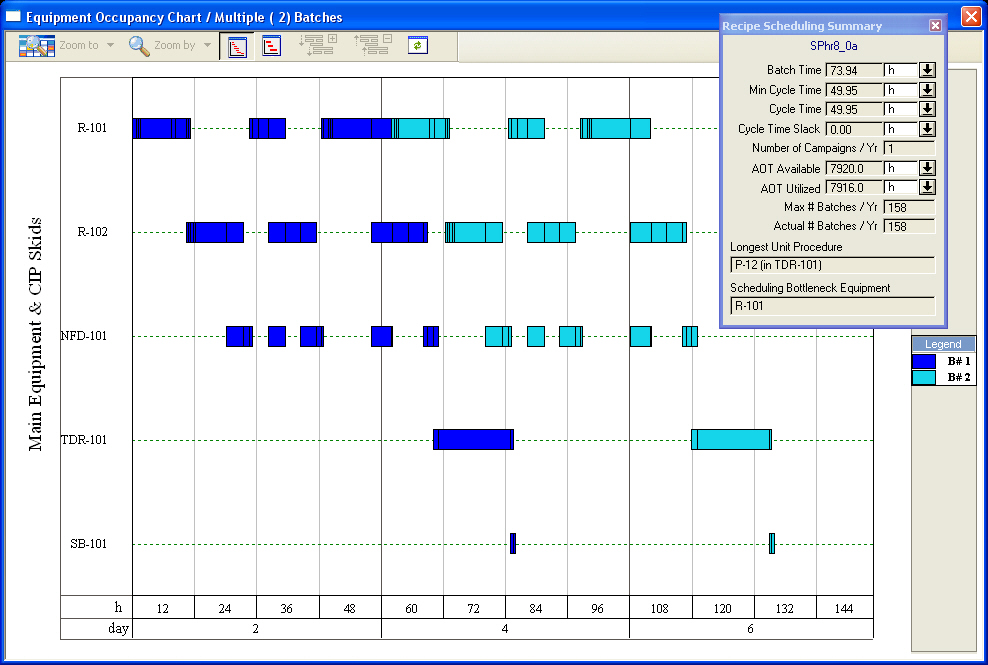
The Equipment Occupancy Chart for two consecutive batches.
The equipment with the least idle time between consecutive batches (or, equivalently, the longest occupancy time per batch) is the time (or scheduling) bottleneck (‘R-101’ in this case). This is the equipment that determines the maximum number of batches per year. Its occupancy time per batch (approximately 50 hours) corresponds to the minimum cycle time (the minimum possible time between consecutive batch starts). The actual recipe cycle time (the actual time between two consecutive batch starts) is equal to the minimum cycle time since the specified slack time between batches is zero for this example. The recipe batch time (the time required to complete a single batch) is roughly 74 hours.
SuperPro Designer also generates charts of resource demand as a function of time for raw materials, heating and cooling utilities, power, and labor. The ‘Operator’ labor resource demand chart for 10 consecutive batches. shows the ‘Operator’ labor resource demand (green line) for this example process and for 10 consecutive batches. A limit of 6 operators has been set through the chart’s Edit Style menu and is also shown on the chart (red line). Note that for short periods of time there is a need for up to six operators. If this exceeds the actual number of operators available, then certain operations will need to be delayed to accommodate the labor constraint. Inventory graphs for raw materials also can be generated in a similar way.
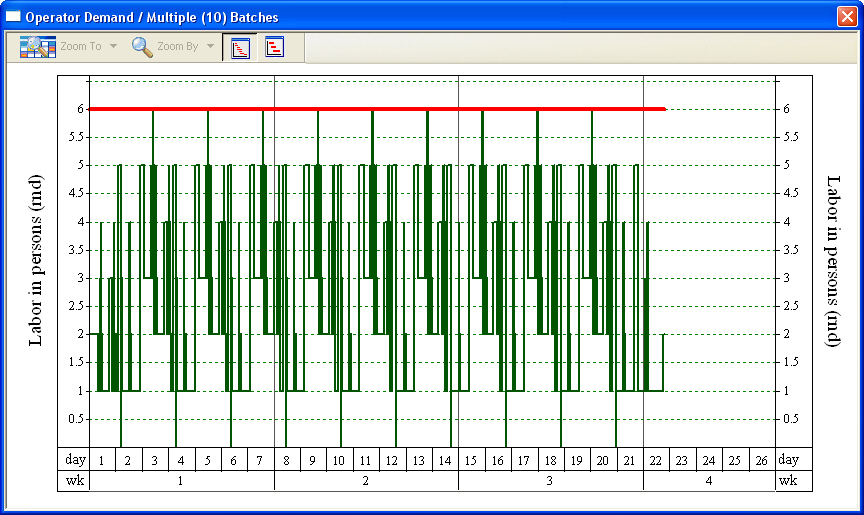
The ‘Operator’ labor resource demand chart for 10 consecutive batches.
For more details on the above charts, see Viewing Scheduling, Equipment Utilization and Resource Tracking Results.
SuperPro Designer is equipped with powerful throughput analysis and debottlenecking capabilities. These include the Utilization Factors chart and the Batch Size Potential chart.
The Equipment Utilization Factors Chart. shows the Utilization Factors chart for this example. This chart presents the capacity, time, and combined equipment utilization in each procedure. A batch size (throughput) bottleneck corresponding to the limiting procedure/equipment combination in terms of highest combined utilization (‘P-10/R-102’ in this case) is also indicated on the chart.
Furthermore, the Batch Size Potential chart for this example is shown in The Batch Size (Throughput) Potential Chart.. In this chart, the total flow of the ‘Final Product’ stream is used as reference for batch size (throughput) calculations. The chart shows for each procedure/equipment combination, the actual batch size (red dotted line) and three estimates (conservative, realistic, and theoretical) of batch size potential. For each estimation method, a size bottleneck is indicated on the chart. This corresponds to the procedure/equipment combination that has the smallest batch size potential based on that estimation method. For this example, the size bottleneck is ‘P-10/R-102’ using any of the above estimation methods.
For more details on these charts, seeThroughput Analysis and Debottlenecking.
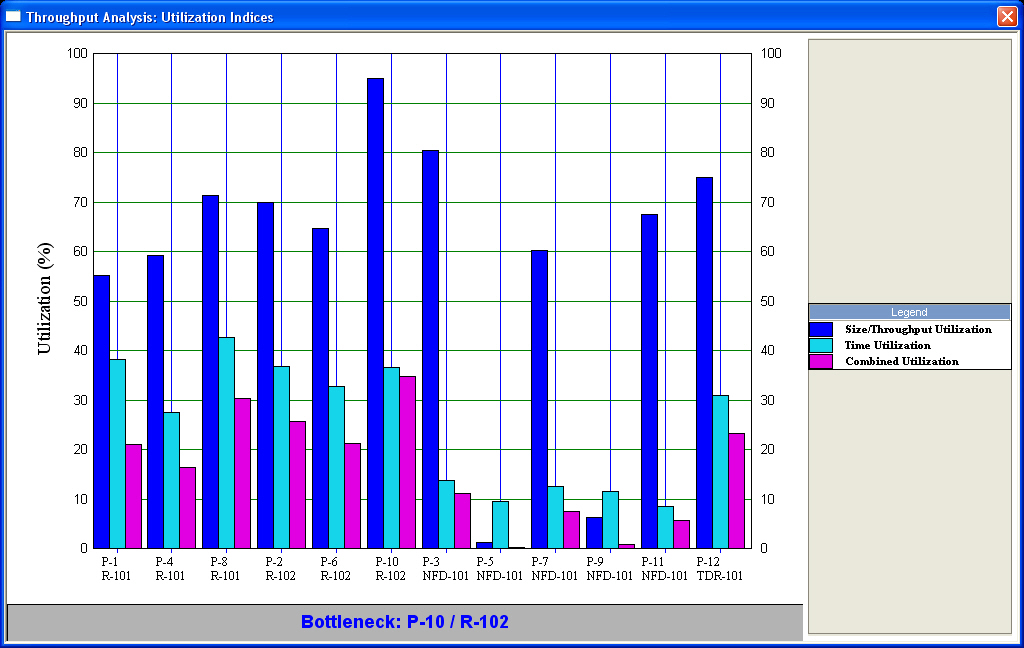
The Equipment Utilization Factors Chart.
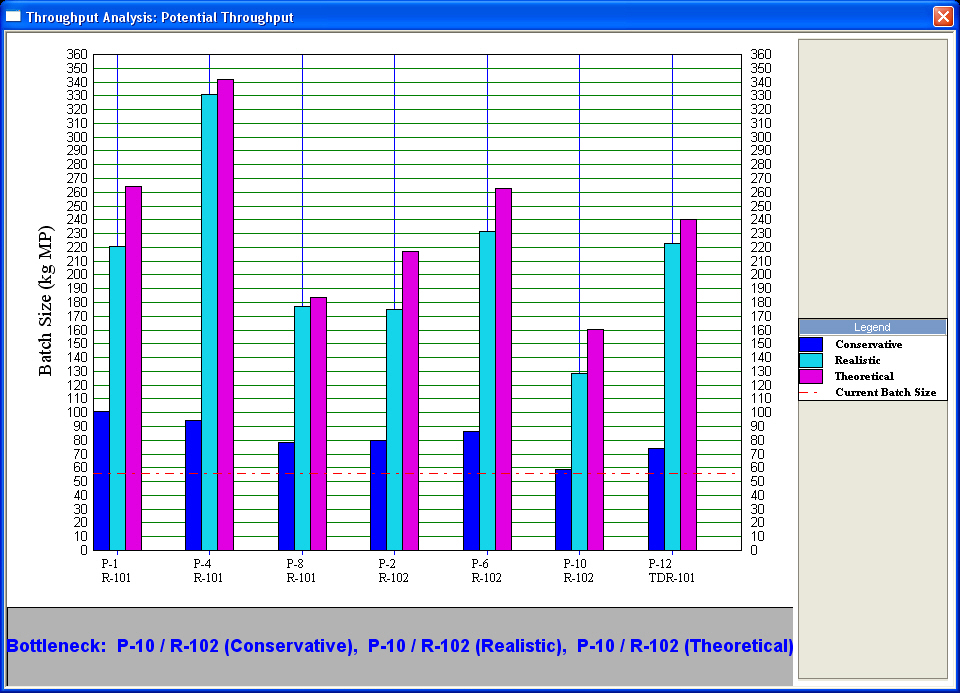
The Batch Size (Throughput) Potential Chart.
SuperPro Designer performs thorough cost analysis and economic evaluation calculations and generates three pertinent reports. These are:
● the Economic Evaluation Report (EER),
● the Itemized Cost Report (ICR), and
● the Cash Flow Analysis Report (CFR).
Below are the key results of cost analysis for a plant producing 8,804 kg of this intermediate per year (around 55.7 kg per batch). The table shown in The executive summary table of the Economic Evaluation Report (EER). provides an overview of the total economic impact of the plant, including the total capital investment, annual revenues, and rate of return. This table was extracted from the PDF version of the Economic Evaluation Report (EER). To generate the EER, click Economic Evaluation Report (EER) on the Reports menu.
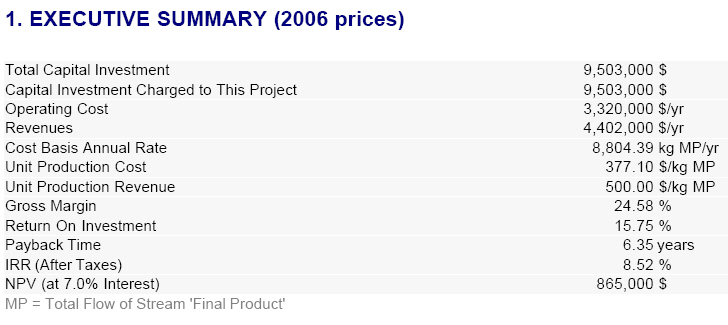
The executive summary table of the Economic Evaluation Report (EER).
The table in The operating costs summary table of the Itemized Cost Report (ICR). provides a cost breakdown per cost item of the total annual operating cost over all process sections for this process. This table was extracted from the PDF version of the Itemized Cost Report (ICR). To generate the ICR, click Itemized Cost Report (ICR) on the Reports menu. The ICR enables the user to readily identify the cost-sensitive sections of a process – the economic hot-spots. For instance, The operating costs summary table of the Itemized Cost Report (ICR). reveals that the largest cost in this example is attributed to Facility-Dependent expenses that account for roughly 50% of the annual operating cost. An increase in equipment sharing may reduce this cost but may also reduce the annual throughput. Approximately another 17% of the annual operating cost is associated with raw materials. This is mainly attributed to the cost of quinaldine (a breakdown of overall material costs can be found in the EER). If a lower-priced quinaldine vendor could be found, the overall process cost would be reduced significantly. Labor and waste treatment/disposal costs are the third and fourth largest annual operating costs, respectively. Labor can be reduced through increased automation. The environmental cost can be reduced through solvent recovery, purification, and reuse.
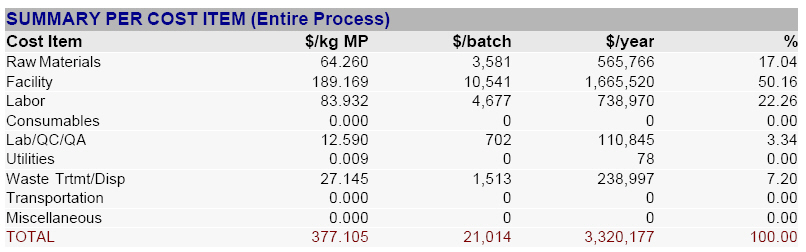
The operating costs summary table of the Itemized Cost Report (ICR).
The above analysis shows how the economic reports can be used as a tool to optimize a process through ‘what-if’ scenarios by examining individual cost items:
● Would it make economic sense to use three reactors instead of two? It depends on how much the throughput would increase if three reactors were used, and how much the third reactor would add to the total cost.
● Would a radically modified purification scheme be better than the current scheme? It depends on what equipment, reagents, etc. would be required in the modified scheme, and what would be the impact on the overall product yield.
This type of what-if analysis is quickly and easily done using SuperPro Designer.
|
|
For a detailed ‘what-if’ analysis example, please refer to the Synpharm.doc ‘ReadMe’ file that can be found in the same directory as the SuperPro Designer files. |
In addition, the CFR can be generated for this example by selecting Cash Flow Analysis (CFR) on the Reports menu. For more details on cost analysis and economic evaluation, see Cost Analysis and Economic Evaluation.
You may also want to generate the Emissions Report (EMS) and the Environmental Impact Report (EIR) for this process. To do that, select Emissions (EMS) or Environmental Impact (EIR) on the Reports menu; for more details, see Environmental Impact.