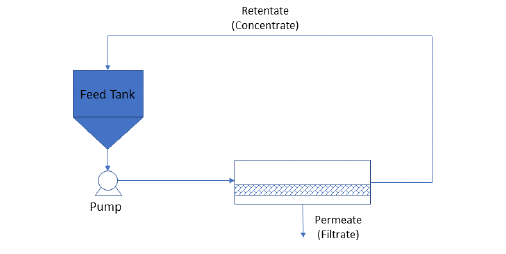
The figure below illustrates a batch membrane filtration unit. This is the fastest method of concentrating a given amount of material and it requires the minimum membrane area. Initially, the feed tank is filled by a solution with a volume VF and a solute, i, concentration CiF. The solution is pumped through the filter, where the permeate is continuously removed while the retentate is recycled, usually at a high volumetric flow rate, Q, to minimize fouling. As solvent selectively passes through the membrane, the retained solution volume in the system decreases so its retentate solute concentration, CiR, increases. The operation is terminated when the desired solute concentration in the retentate is achieved. At that point, the feed tank and associated equipment contain the final retentate, VR.
● Microfiltration (Batch) Procedure
● Microfiltration (Feed and Bleed) Procedure
● Ultrafiltration (Batch) Procedure
● Ultrafiltration (Feed and Bleed) Procedure
● Reverse Osmosis (Batch) Procedure
● Reverse Osmosis (Feed and Bleed) Procedure
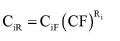
In batch concentration, the concentration of a solute, i, in the retentate at the end of the operation, CiR, is given by:
|
|
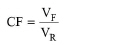
where CiF is the concentration of the solute in the feed, Ri is the rejection coefficient, and CF is the concentration factor expressed as the ratio of the feed volume, VF, divided by the volume of the retentate, VR:
|
|
From eq. (A.85) one can derive the concentration yield (fi) of component i, (fi) , which is the ratio of the component mass in the retentate divided by the respective mass in the feed:
|
|
eq. (A.87) |
To simulate product denaturation due to shear forces during membrane filtration, the user identifies the active and denatured forms of the product component and specifies the denaturation fraction. If the denaturation fraction is zero or if either the active or the denatured product component is not identified, no product denaturation is considered.
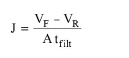
In Design Mode, the user specifies the average permeate flux (J), the concentration factor (CF), the filtration time (tfilt), and the rejection coefficients of the various particulate components. Then, the following equation is solved for A (the membrane area):
|
|
eq. (A.88) |
where VF is the volume of material fed to the membrane filtration step per cycle.
If the calculated membrane area exceeds the maximum allowable membrane area per unit, the program assumes multiple identical units operating in parallel with a total membrane area equal to the calculated.
The permeate flux depends on the type of the membrane and the composition of the feed stream. For fermentation broths, the flux of microfiltration membranes usually ranges between 10 and 20 L/m2-h. For water treatment with RO membranes, the flux is usually in the range of 22-25 L/m2-h for city water and 13-17 L/m2-h for wastewater. The flux of UF membranes that filter water is 2-3 times the flux of RO membranes. The flux of vibrating membrane filters, such as the VSEP unit from New Logic International, is usually three times the flux of non-vibrating membrane filters.
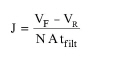
In Rating Mode, the user specifies the area (A) of the membrane filter, the number of identical units operating in parallel (N), the concentration factor (CF), the rejection coefficients of the various components, and either the Filtration Time or the average permeate flux (J). Then, the following equation is solved either for J (when the filtration time is specified) or for Filtration Time (when the average permeate flux is specified:
|
|
eq. (A.89) |
The equipment purchase cost is estimated using built-in correlations derived from vendor data. It is a function of filter area and filter type (e.g., microfilter, ultrafilter, reverse osmosis). It is also a function of the industry where the unit is used. For instance, the special requirements for piping materials and welding in the biopharmaceutical industries drive the prices up. Consequently, a unit sold to the biopharmaceutical industry may cost 2-5 times the cost of a similar unit (same membrane size) sold to the food or water treatment industries.
For large membrane installations in the food and water industries, the cost of hardware is in the range of $70-100/m2 of membrane area. For small installations in the biopharmaceutical industry, the hardware cost is approximately 10 times higher.
The cost associated with the periodic replacement of membranes contributes to cost of Consumables. This cost is calculated based on the replacement frequency (in Operating Hours or Number of Cycles), the membrane unit cost (in $/m2), and the filtration time (specified by the user or calculated by the program).
The membrane unit cost depends on the type of membrane, the size of installation and the type of the industrial end-user. For instance, for large RO installations in the water industry, the unit cost of the membrane is around $15/m2. The cost of UF membranes for similar installations is 3-4 times the cost of RO membranes. For small installations in the biopharmaceutical industry, the unit cost of membranes is in the range of $150-500/m2.
The cost of electricity is estimated based on the Specific Power Requirement (in W/m2) that can be adjusted by the user. The user also has the option to specify the total consumed power. The heating or cooling duty and the associated costs are calculated based on the energy balance around the unit.
Membrane filters need regular cleaning, every 4 to 30 hours of operation (in biotech applications), in order to maintain high flux and longevity. The average life of membranes strongly depends on the degree of utilization and the operating conditions and in the biotech industry usually ranges from 6 to 12 months (or 1000 to 2000 hours of operation time). In the water industry, membranes are utilized 2-5 years before replacement.
1. W.C. McGregor (editor) (1986). Membrane Separations in Biotechnology, Marcel Dekker, Inc., New York and Basel.
2. J.D. Seader, Ernest J. Henley and D. Keith Roper (2010), Separation Process Principles - Chemical and Biochemical Operations, John Wiley & Sons, Inc.
The interface of this operation has the following tabs:
● Oper. Cond’s, see Batch Concentration: Oper. Conds Tab
● Utilities, see Batch Concentration: Utilities Tab
● Labor, etc, see Operations Dialog: Labor etc. Tab
● Description, see Operations Dialog: Description Tab
● Batch Sheet, see Operations Dialog: Batch Sheet Tab
● Scheduling, see Operations Dialog: Scheduling Tab