Continuous membrane filtration (microfiltration, ultrafiltration, reverse osmosis) is employed in cases where large volumetric throughputs are involved (e.g., in dairy, beverage, and semiconductor industries). In tangential microfiltration, cross flow parallel to the filter surface is used to enhance filtrate flux. The pore sizes of microfilter membranes usually range from 0.1 to 0.45 microns. Microfiltration is used for solid-liquid separations. In bioprocessing, microfiltration is commonly used for cell harvesting, cell debris removal, and sterilization of cell culture media.
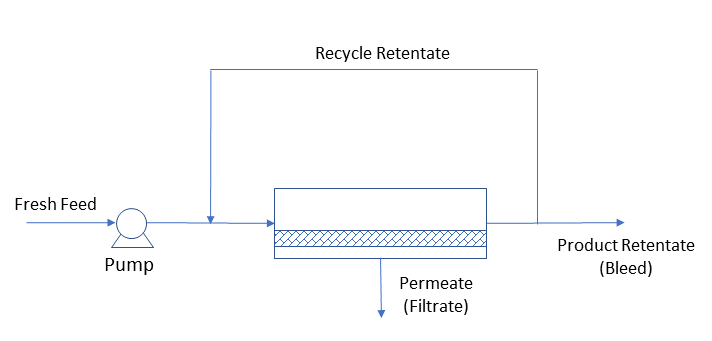
The feed-and-bleed mode of operation comes closest to simulating continuous full-scale operation by recycling, at steady state, a large fraction of the retentate. In effect, membrane feed is the sum of fresh feed and recycle retentate. The bleed is that portion of the retentate not recycled, but withdrawn as product retentate. Notice that at startup, the entire retentate is recycled until the desired retentate concentration is achieved, at which time bleed is initiated.
The disadvantage of feed-and-bleed membrane filtration is that the process loop is operating continuously at a concentration factor equivalent to the final concentration of a batch system. The flux, therefore, is lower than the average batch mode flux and therefore, the membrane area required is correspondingly higher.
To overcome the low flux disadvantage of the ‘feed-and-bleed’ operation, and yet to maintain its continuous nature, large-scale continuous plants are usually staged, using several individual feed-and-bleed stages (to model staged systems in SuperPro Designer, multiple membrane filtration units must be used in series). The stages are operated in series as far as concentrate/feed flow is concerned but in parallel with respect to permeate flow. Usually a minimum of 3 stages are required, and 7-10 stages are quite common. The residence time, volume hold-up, and tankage required is much less than for the same duty in batch operation. In addition, such continuous systems can be operated in a sanitary manner over a 24-hour cycle, with a single 2-3 hour cleaning and sanitizing break per 24 hours being adequate. In contrast, due to microbiological or product stability considerations, batch systems are usually restricted to a 4-8 hour operational cycle. Recovering the product, cleaning, sanitizing, and refilling the feed tank make take another 2 hours. The batch plant may be in actual operation for only 2-4 cycles per 24-hour day. Hence although the average flux rate may be higher and membrane area lower with a batch plant, the total volume throughput on a daily basis is higher in the multistage continuous plant.
● Microfiltration (Batch) Procedure
● Microfiltration (Feed and Bleed) Procedure
● Ultrafiltration (Batch) Procedure
● Ultrafiltration (Feed and Bleed) Procedure
● Reverse Osmosis (Batch) Procedure
● Reverse Osmosis (Feed and Bleed) Procedure
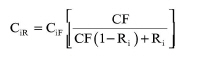
In feed-and-bleed membrane filtration, the concentration of a solute, i, in the retentate, CiR, is given by:
|
|
eq. (A.90) |
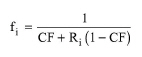
while the respective concentration yield (fi), i.e., the component mass flowrate in the retentate divided by the respective flowrate in the feed, is equal to:
|
|
eq. (A.91) |
where CiR is the cocentration of the solute in the feed, Ri is the rejection coeffcient and CF is the concentration factor expressed as:
|
|
eq. (A.92) |
where QF and QR are the volumetric flowrates of the feed stream and bleed retentate, respectively.
To simulate product denaturation due to shear forces during membrane filtration, the user identifies the active and denatured forms of the product component and specifies the denaturation fraction. If the denaturation fraction is zero or if either the active or the denatured product component is not identified, no product denaturation is considered.
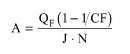
In Design Mode, the user specifies the average permeate flux (J), the concentration factor (CF), and the rejection coefficients of the various particulate components. The membrane area, A, is then calculated by the following equation:
|
|
where QF is the volumetric flowrate of the feed and N is the number of identical units operating in parallel. The above equation is first solved for a single unit. If the calculated membrane area exceeds the maximum allowable membrane area per unit, the program assumes multiple identical units operating in parallel with a total membrane area equal to the calculated.
In Rating Mode, the user specifies the area (A) of the membrane filter, the number of identical units operating in parallel (N), the concentration factor (CF), and the rejection coefficients of the various components. Then, eq. (A.93) is solved for J to calculate the average permeate flux.
The permeate flux depends on the type of the membrane and the composition of the feed stream. For fermentation broths, the flux of microfiltration membranes usually ranges between 10 and 20 L/m2-h. For water treatment with RO membranes, the flux is usually in the range of 22-25 L/m2-h for city water and 13-17 L/m2-h for wastewater. The flux of UF membranes that filter water is 2-3 times the flux of RO membranes. The flux of vibrating membrane filters, such as the VSEP unit from New Logic International, is usually three times the flux of non-vibrating membrane filters.
The equipment purchase cost is estimated using built-in correlations derived from vendor data. It is a function of filter area and filter type (e.g., microfilter, ultrafilter, reverse osmosis). It is also a function of the industry where the unit is used. For instance, the special requirements for piping materials and welding in the biopharmaceutical industries drive the prices up. Consequently, a unit sold to the biopharmaceutical industry may cost 2-5 times the cost of a similar unit (same membrane size) sold to the food or water treatment industries.
For large membrane installations in the food and water industries, the cost of hardware is in the range of $70-100/m2 of membrane area. For small installations in the biopharmaceutical industry, the hardware cost is approximately 10 times higher.
The cost associated with the periodic replacement of membranes contributes to cost of Consumables. This cost is calculated based on the replacement frequency (in Operating Hours or Number of Cycles), the membrane unit cost (in $/m2), and the filtration time (specified by the user or calculated by the program).
The membrane unit cost depends on the type of membrane, the size of installation and the type of the industrial end-user. For instance, for large RO installations in the water industry, the unit cost of the membrane is around $15/m2. The cost of UF membranes for similar installations is 3-4 times the cost of RO membranes. For small installations in the biopharmaceutical industry, the unit cost of membranes is in the range of $150-500/m2.
The cost of electricity is estimated based on the Specific Power Requirement (in W/m2) that can be adjusted by the user. The user also has the option to specify the total consumed power. The heating or cooling duty and the associated costs are calculated based on the energy balance around the unit.
Membrane filters need regular cleaning, every 4 to 30 hours of operation (in biotech applications), in order to maintain high flux and longevity. The average life of membranes strongly depends on the degree of utilization and the operating conditions and in the biotech industry usually ranges from 6 to 12 months (or 1000 to 2000 hours of operation time). In the water industry, membranes are utilized 2-5 years before replacement.
1. W.C. McGregor (editor) (1986). Membrane Separations in Biotechnology, Marcel Dekker, Inc., New York and Basel.
2. J.D. Seader, Ernest J. Henley and D. Keith Roper (2010), Separation Process Principles - Chemical and Biochemical Operations, John Wiley & Sons, Inc.
The interface of this operation has the following tabs:
● Oper. Cond’s, see Batch Concentration: Oper. Conds Tab
● Utilities, see Batch Concentration: Utilities Tab
● Labor, etc, see Operations Dialog: Labor etc. Tab
● Description, see Operations Dialog: Description Tab
● Batch Sheet, see Operations Dialog: Batch Sheet Tab
● Scheduling, see Operations Dialog: Scheduling Tab