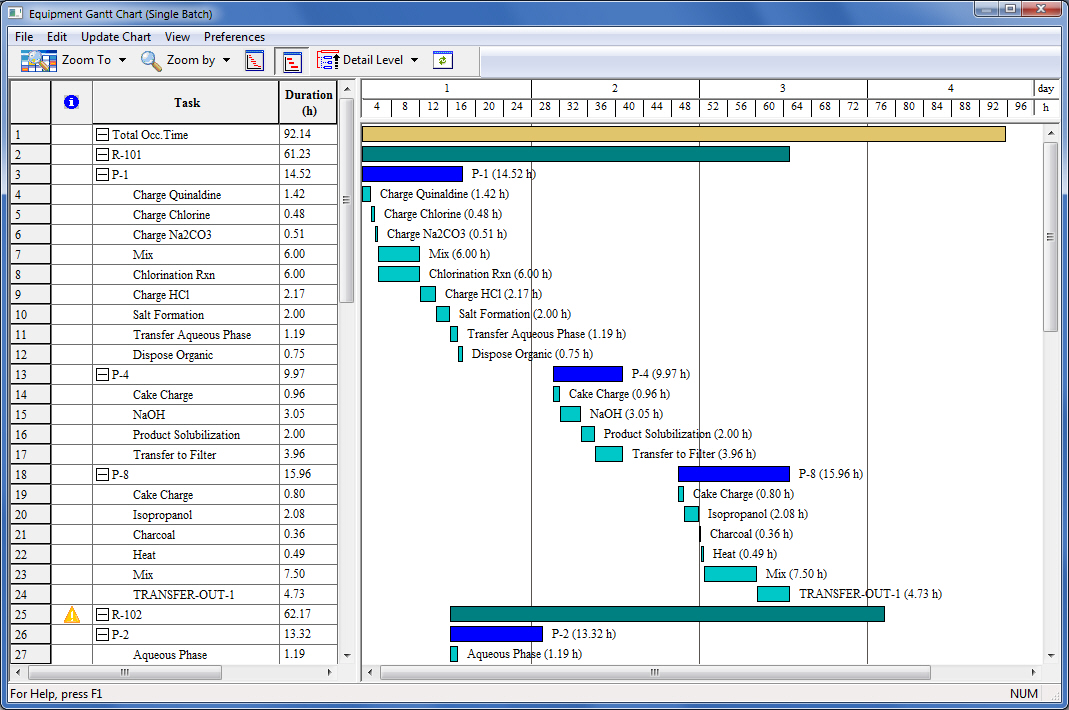
This dialog appears when you select Charts } Gantt Charts } Equipment GC from the main menu of the application.
The window presents in a dual view (grid and chart) all equipment occupancy information in the form of a hierarchically arranged task (activity) bars. Each horizontal task bar shown in the chart represents the time that the corresponding activity is ‘on’. There are seven levels of activities considered by the equipment gantt chart. Those levels in order of hierarchy are as follows:
1. Batch
2. Branch
3. Section
4. Equipment
5. Procedure
6. Cycle
7. Operation
Each task (activity) bar in the above hierarchy expands into subtasks of the level below. Since branches and sections may not be used often in a process they can be optionally skipped and thereby have batch bars expand directly into equipment bars, see Equipment Gantt Chart Style Dialog: Contents tab. Each bar has its own visual style that can be customized by the user. Simply right-click on the type of activity you wish to modify its style and select Edit Style from its command menu, see Equipment Gantt Chart Style Dialog. You may also want to display a short description of the activity next to the task bar (perhaps for some of the activity types, e.g. operations). The style dialog of the activity allows you to turn this feature on or off, see Equipment Gantt Chart Bar Style Dialog: Bar Options tab.There are other aspects of the chart that can be modified to suit the user’s preferred view. The actual contents of the chart can be dictated b the user:
a) You can elect to skip some of the levels of hierarchy shown above
b) You may opt to exclude some the auxiliary equipment and/or determine the order of appearance according to your liking (by default, the order of appearance follows the order of engagement, earliest to latest, for each equipment)
c) You may change the number of attributes shown on the grid side of the interface.
All of the above can be modified from the chart’s style dialog (contents tab).
As in any other time chart, the time line attributes first come up in accordance with the defaults kept by the process. However, they can be customized as deemed necessary for this chart, see Graph Style Dialog (All Time Charts): Time Line Tab.
Typically the chart will come up in the ‘Fit-to-window’ viewing mode where all activity bars are showing simultaneously in one window width (no horizontal scrolling necessary). You can switch out from this view to the ‘Nominal Viewing’ mode (using the toolbar, see Toolbar for All Time Charts) or you can zoom by any percentage you wish or to any time-span that you chose (week, day, etc.), see Zooming / Time Scale. The chart can either be printed, see Print/Print Preview or exported (as a picture) in order to be included in other Windows applications, see Copying / Exporting Chart As Picture. Finally, the chart’s scheduling data can also be exported into an Excel-compatible format (in case they need to be imported and manipulated further), see Exporting Chart’s Data. All of the above actions can be initiated by right-clicking on an empty area of the chart, and thereby invoking the chart’s command menu.
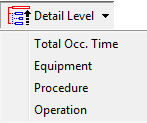
You can expand a summary task bar (i.e. a task bar that contains subtasks) either from the grid view or from the chart view. From the grid view, find the line that represents the task and click on the ‘+’ box displayed in front of it (if the task is already expanded then instead of the ‘+’ a ‘-’ will be shown; clicking on the ‘-’ will collapse the subtasks of the summary bar). The activity bars can also be expanded and/or collapsed from the chart view. Right-click on a summary bar and from the command menu that appears you can select Expand to expand this summary bar to its first level subtasks, Expand All to expand this task bar and all its subtasks all the way to the elementary tasks, or Collapse if you want to collapse the subtasks back to the summary bar. Finally the user may click on the Detail Level button ( ) to expand or collapse the Gantt chart to the chosen level as seen in the following image:
If you right-click over an activity bar a special command menu will appear:
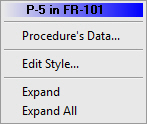
The actual contents of the menu depend on the type of activity bar you clicked over. The above picture shows the menu that appears after right-clicking over a procedure bar. Selecting Procedure Data is equivalent to selecting Procedure Data from the procedure’s icon command menu and will bring up the procedure dialog. If the bar under the mouse represented an operation activity, then the first line would be Operation Data Selecting this option would display the i/o simulation dialog of the operation under the bar. If you edit any data values in any of those dialogs and exit with OK, then the contents of the displayed chart may not reflect your most recent changes. Instead of updating the chart every time you exit a data dialog, the application will only update the chart upon your command. You can redo the M&E balances, the scheduling calculations and refresh the contents of the chart by clicking on the Refresh button ( ) of the chart’s toolbar.
Selecting the Scheduling Summary option from the chart’s command menu will present a popup window which displays all the recipe-level scheduling parameters (annual operating time, cycle time, number of batches per year, etc.). For more details on what is displayed on this popup, see Recipe Summary Information Popup. This information is for display only and it is updated every time the chart contents is refreshed. It provides you with the means to monitor the effect on the recipe’s scheduling parameters as triggered by changes initiated in this interface. If you want to edit some of the recipe-level scheduling parameters (like recipe cycle time, cycle time slack, etc.), you need to access the Recipe Scheduling Information Dialog; please select Edit Recipe Scheduling Info from the command menu of the chart (available in multi-batch charts only).
Cycle information can be viewed by right clicking on a cycle activity bar and selecting the first option in the command menu (see Cycle Description Dialog for details on this interface).
For details on each command of the right click context menu of this chart see the following table:
|
Set Number of Batches |
|
This option is only available if the multiple batches chart is being displayed. Allows you to set the number of batches that you wish to be included in the chart. |
|
Fit to Window |
|
Compress the entire time line so that it fits within the available width of the Gantt Chart’s window. |
|
Zoom In |
|
Expand the drawing of the time line (see more details but less of the graph). |
|
Zoom Out |
|
Shrink down the drawing of the time line (see less details but more of the graph) |
|
Styles |
Gantt Chart |
Edit the style attributes for the Gantt Chart. |
|
|
Batch Bar |
Edit the style attributes of the batch summary bar in the Gantt Chart |
|
|
Branch Bar |
Edit the style attributes of the branch summary bar in the Gantt Chart |
|
|
Section Bar |
Edit the style attributes of the section summary bar in the Gantt Chart |
|
|
Procedure Bar |
Edit the style attributes of the procedure summary bar in the Gantt Chart |
|
|
Cycle Bar |
Edit the style attributes of the cycle summary bar in the Gantt Chart |
|
|
Operation Bar |
Edit the style attributes of the operation bar in the Gantt Chart |
|
|
Equipment Bar |
Edit the style attributes of the equipment occupation time summary bar in the Gantt Chart |
|
Include / Exclude / Order Equipment |
|
Will bring up a dialog that allows you to choose which equipment to include /exclude from the gantt chart and also set their order of appearance in the gantt chart. |
|
Copy Gantt Chart |
|
Copies the entire chart to the clipboard. |
|
Copy Gantt Spreadsheet |
|
Copies the spreadsheet shown on the left of the Gantt interface to the clipboard.The spreadsheet is copied at the state that is currently shown when the command is issued, so any lines that are collapsed will not show. |
|
Export Gantt Chart as Metafile |
|
Will save the chart image as a windows metafile (‘wmf’). |
|
Export Scheduling Data to MS Excel |
|
Will export the scheduling data displayed in the chart in an Excel compatible file. |
|
Export Data to MS Project |
|
Will save all the scheduling data to a file which can be imported in MS Project. |
|
Edit Recipe Scheduling Info |
|
Allows you to edit the recipe scheduling information. This menu option is only available if you are displaying multiple batches. |
|
Scheduling Summary |
|
Will show (if it’s not already visible) or hide (if it’s currently visible) the scheduling summary popup window for the active recipe (shown in the Gantt chart). |
|
Zoom Toolbar |
|
Hides or Shows the zoom toolbar |
|
Print Preview |
|
Displays the chart on screen as it would appear printed. |
|
Print Chart |
|
Prints the active chart. |
The first column in the grid of the gantt charts can display an icon which represents a different state of equipment and procedures. The following table explains these icons:
|
Info Icon |
Meaning |

|
Indicates the bottleneck equipment. |

|
Indicates the longest procedure. |

|
Indicates an equipment sharing violation exists. |

|
Indicates the equipment is in staggered mode. |