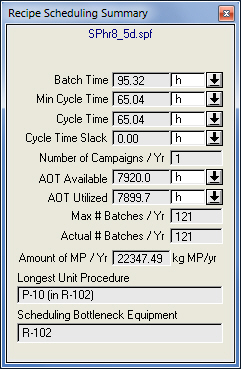

This popup appears (and stays on top of your working interface) when you select Scheduling Summary from the command menu of any of the time charts (single or multiple batches).
This window is for display purposes only and it can be hidden at any time by clicking on its top-right corner. The values of all quantities displayed in this window are automatically updated every time the contents of the chart are being refreshed. Users may find it useful to view those parameters as a monitor of the impact on the overall process scheduling of any changes made through the chart that you are currently viewing:
|
Variable |
Default Value |
Range |
|
|
||
|
● Batch Time |
24h |
Positive |
|
● Min Cycle Time |
0.0h |
Positive |
|
● Cycle Time Slack |
0.0 |
Positive |
|
● Number of Campaigns |
1 |
Positive Integer |
|
● AOT Available |
7920h |
Positive |
|
● AOT Utilized |
7920h |
0 - AOT Available |
|
● Max # Batches/ Yr |
0.0 |
Positive |
|
● Actual # Batches / Yr |
0.0 |
0 - Max # Batches |
|
● Amount of MP / Yr |
0.0 |
Positive |
|
● Longest Unit Procedure |
(none) |
Any UP Name |
|
● Scheduling Bottleneck Equipment |
(none) |
Any Equip Res Name |
Symbol Key: ○ User-specified value (always input); ● Calculated value (always output); ◙ Sometimes input, sometimes output
For more information on the terms used in this window and how they are calculated see Scheduling Calculations.