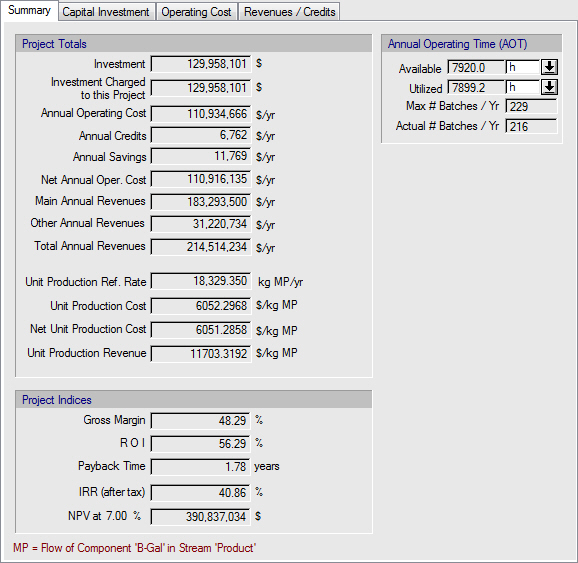
This tab is part of the ‘Executive Summary for Project’ dialog; for more details, see Executive Summary Dialog.
The following table shows a brief description of the variables appearing in this tab. The table also displays their default values and their generally acceptable range:
|
Variable
|
Default Value
|
Range
|
|
|
|
● Investment ($)
The total capital investment of a process; for more details, see Total Capital Investment.
|
0.0
|
Positive
|
|
● Investment Charged to this Project ($)
The fraction of a process’s total capital investment that is charged to this project; for more details, see Capital Investment Charged to This Project.
|
0.0
|
Positive
|
|
● Annual Operating Cost ($/yr)
The annual operating cost (AOC) of the project; for more details, see Operating Cost.
|
0.0
|
Positive
|
|
● Annual Credits ($/yr)
The annual proceeds from plant operation associated with streams and generated power types denoted as credit or credited heating agents. Note that if no credits are specified, this variable will not be displayed; for more details, see Credits.
|
0.0
|
Positive
|
|
● Annual Savings ($/yr)
The annual savings from plant operation associated with recycled power types or recovered energy. Note that if no savings exist, this variable will not be displayed; for more details, see Savings.
|
0.0
|
Positive
|
|
● Net Annual Oper. Cost ($/yr)
The AOC minus annual credits. Note that if no credits are specified, this variable will not be displayed; for more details, see Net Annual Operating Cost.
|
0.0
|
Positive
|
|
● Main Annual Revenues ($/yr)
The annual revenues associated with the stream that is specified as the “Main Product/Revenue” stream. Note that this variable is only displayed if there are more than one revenue streams; for more details, see Revenues.
|
0.0
|
Positive
|
|
● Other Annual Revenues ($/yr)
The annual revenues of a project in addition to the main annual revenues. Note that this variable is only displayed if there are more than one revenue streams; for more details, see Revenues.
|
0.0
|
Positive
|
|
● (Total) Annual Revenues ($/yr)
The (total) annual proceeds from plant operation associated with streams and generated power types denoted as revenue; for more details, see Revenues.
|
0.0
|
Positive
|
|
● Annual Production Rate (or Annual Processing Rate or Cost Basis Annual Rate) (kg MP/yr)
The selected annual mass flow rate basis (total flow or component flow) of the stream that is specified as the “Unit Reference” stream through the “Rate Reference Flows” dialog. If the “Main Product/Revenue” stream is selected, the corresponding annual rate is denoted as “processing” or “production’, respectively. If a different stream is selected, this corresponding annual rate is denoted as “cost basis’. Note that if a “Unit Reference” stream does not exist, this variable will not be displayed; for more details, see Operating Cost.
|
0.0
|
Positive
|
|
● Unit Production Cost (or Processing) Cost ($/kg MP)
A reference unit cost that is calculated by dividing the AOC by the annual mass flow rate basis (total flow or component flow) of the stream that is specified as the “Unit Reference” stream through the “Rate Reference Flows” dialog. Depending on whether this is a process input or output stream, the corresponding cost is denoted as “processing” or “production’, respectively. Note that if a “Unit Reference” stream does not exist, this variable will not be displayed; for more details, see Operating Cost.
|
0.0
|
Positive
|
|
● Net Unit Production (or Processing) Cost ($/kg MP)
A reference unit cost that is calculated by dividing the net AOC by the annual mass flow rate basis (total flow or component flow) of the stream that is specified as the “Unit Reference” stream through the “Rate Reference Flows” dialog. Depending on whether this is a process input or output stream, the corresponding cost is denoted as “processing” or “production’, respectively. Note that if a “Unit Reference” stream does not exist, this variable will not be displayed; for more details, see Operating Cost.
|
0.0
|
Positive
|
|
● Unit Production (or Processing) Revenue ($/kg MP)
A reference unit revenue that is calculated by dividing the annual revenues by the annual mass flow rate basis (total flow or component flow) of the stream that is specified as the “Unit Reference” stream through the “Rate Reference Flows” dialog. Depending on whether this is a process input or output stream, the corresponding cost is denoted as “processing” or “production’, respectively. Note that if a “Unit Reference” stream does not exist, this variable will not be displayed; for more details, see Revenues.
|
0.0
|
Positive
|
|
● Gross Margin (%)
This is a measure of profit that directly tells you what percentage of the annual revenues is gross profit; for more details, see Profitability Analysis.
|
0.0
|
Positive
|
|
● ROI (%)
The return on investment (ROI) is a profitability measure used to evaluate the viability of an investment or to compare the profitability of a number of different investments; for more details, see Profitability Analysis.
|
0.0
|
Positive
|
|
● Payback Time (years)
This is a measure of the time needed for the total capital investment to be exactly balanced by the cumulative net profits; for more details, see Profitability Analysis.
|
0.0
|
Positive
|
|
● IRR (after tax) (%)
The internal rate of return (IRR) after taxes is the interest rate for which the net present value (NPV) of a project is zero; for more details, see Cash Flow Analysis.
|
0.0
|
Positive
|
|
● NPV at 7% ($)
The net present value (NPV) is a profitability measure used to evaluate the viability of an investment or to compare the profitability of a number of different investments; it represents the total value of future net cash flows during the lifetime of a project, discounted to reflect the time value of money at the beginning of the project; here, it is calculated for the low value specified for the interest rate. The default value of the program for this rate is 7%; for more details, see Cash Flow Analysis.
|
0.0
|
Positive
|
|
● Available Annual Operation Time (AOT)
See Scheduling Terms & Definitions.
|
0.0
|
Positive
|
|
● Utilized Annual Operating Time (AOT)
Shown only if the operating mode of the process is batch. See Scheduling Terms & Definitions.
|
0.0
|
Positive
|
|
● Maximum Number of Batches per Year
Shown only if the operating mode of the process is batch. See Scheduling Terms & Definitions.
|
0
|
Positive
|
|
● Actual Number of Batches per Year
Shown only if the operating mode of the process is batch. See Scheduling Terms & Definitions.
|
0
|
Positive
|