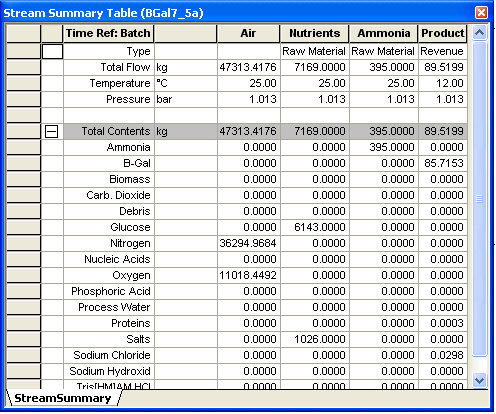
Oftentimes, it is desirable to focus our attention on certain streams and more specifically on certain properties of those streams. Perhaps the flowrate of a certain component in a stream may be very critical, or the mole fraction of a component in a stream may be of greatest importance amongst your simulation outputs. The stream summary table serves exactly that need. It is a customizable stream table summary that you can include the streams you wish and view only the stream properties that are important for your process. It is shown as a separate tab on the horizontal toolbar (sharing space with the error output window) shown (originally) at the bottom of the workspace (but it can be also be docked at the top of the workspace or be left floating). A sample stream summary table is shown below
The Stream Summary Table.
You can show/hide the stream summary table by selecting View } Stream Summary Table from the application’s main menu, or by clicking on the Toggle Stream Summary Table button ( ) of the main toolbar. The table when first viewed is empty (has nothing to show). To display your choice of stream properties for a set of streams that may be of importance to you, right-click over the table (to display the stream summary table’s context menu) and from the menu select Edit Contents.
If you right-click over the stream table, the following menu will appear:
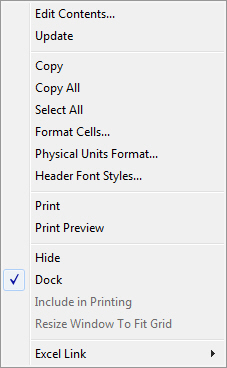
The Stream Summary Table’s Context (Right-Click) Menu.
From this menu you may dictate that the table be floating or docked (check or un-check Dock). If the table is floating then you resized it and locate it any where you wish over the flowsheet. In fact, you can pick Include in Printing and then print the flowsheet; this way the flowsheet will come out with the stream table showing on top. You can directly Print (or Print Preview) the table alone. When the table is floating (thus re-sizable) you can select Resize Window to Fit Grid to make sure the window is sized just right to fit the contents of the grid (if that’s possible). You may copy either a selected range of cells or all the stream’s contents by selecting Copy or Copy All and then paste them in another application. Keep in mind that the stream table contents change from time to time: for example, after performing a M&E balance calculation, some of the flows, compositions, etc. for streams shown on the table may change. The application will updated the table’s contents automatically. If you are monitoring an input stream, the values may change if you visit the i/o dialog of the input stream and change some of its properties. The stream table contents, once again, should change to reflect the new values. If you believe that any part of the table is still not up-to-date, you can issue an Update command to force the refreshing of the table’s contents.
Selecting Edit Contents from the table’s context menu (see The Stream Summary Table’s Context (Right-Click) Menu.) will present the Stream Summary Table: Edit Contents Dialog that allows you to customize the contents (rows and columns) of the table by specifying:
a) Which streams to include: Streams can be process inputs, outputs or intermediates.
b) Which stream properties to display for each stream: you can select from a long list of attributes which ones to include for monitoring directly on the table: stream classification, total flow, temperature, pressure, liquid/solid (L/S) flow, L/S volume, L/S density, total or specific enthalpies, heat capacity.
c) Which component to skip from the total contents section, the liquid/solid section or the gaseous section (if needed).
If you highlight (select) a range of cells in the table and then select Format Cells from the table’s context menu you will be presented with the Cell Format Dialog, that allows you to apply some visual formatting on the cells. Please note that the formatting will not be lost if:
a) You edit the stream table’s contents, or
b) You close the process document
If you want to have some formatting be more of a permanent nature, then you should visit the Physical Quantities Format Dialog. Styles of row and column headers can be formatted by selecting Header Font Styles... from the tables context menu.
Sometimes you may find it necessary to have the contents of the table mapped into an Excel spreadsheet so that you can either show the values as part of an elaborate and highly customized report or simply feed the values to some other custom calculations captured as macros or scripts in the Excel file. For such cases, you will find the Excel Link feature extremely useful. Selecting Excel Link } Edit from the command menu of the table will present you with the Link Table to MS-Excel Dialog that can capture all the information needed so that the application can map all the values of the table straight into an Excel file. There’s several options as to how exactly the updating will be done and they are all explained in detail in the documentation that is part of the dialog. Once a link has been established, the application will directly update the values of the displayed properties either after your command (selecting Excel Link } Update from the command menu) or automatically (if the ‘Auto-Update’ feature is check in the Excel link specification).
|
|
The Excel Link information can also be customized by the COM interface of the application. Typically, users will specify all of the Excel Linking information using the application’s interface (and save it as part of the process file) and later use the COM interface to update the Excel spreadsheet when convenient (e.g. after setting certain input variables and re-solving the M&E balances). This is a relatively quick and convenient way to use a base case design for performing sensitivity calculations and easily record the output in Excel tables. |
When you no longer need the Excel linking information to be part of the saved properties of the table, simply select Excel Link } Delete from he command menu of the table.
