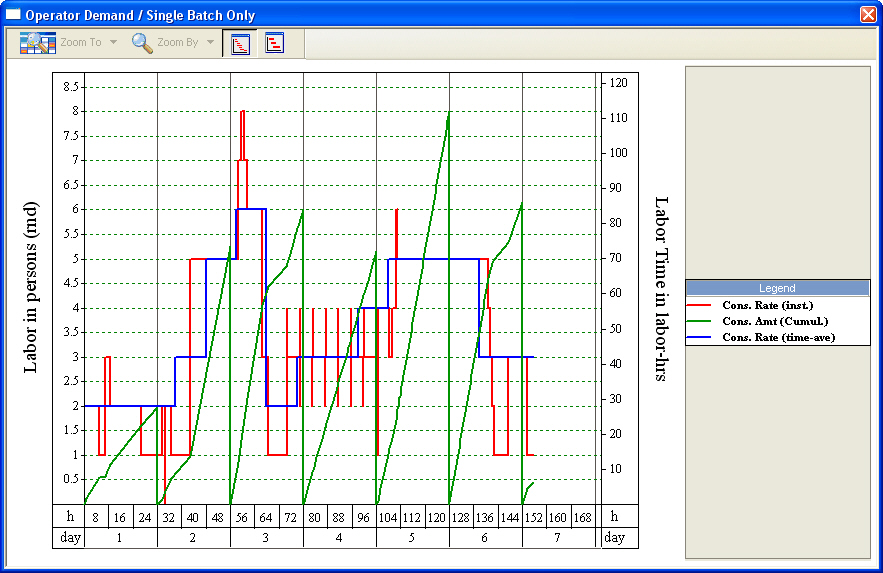
This dialog appears when you select Charts } Labor } Single Batch from the main menu of the application.
Before you view the chart you will be presented with a dialog from where you must select the labor resource whose demand you wish to track.
For more details on the options presented by this dialog, see Labor Type Selection For Demand Chart.
You can dictate which tracking lines to appear on the chart (actual consumption rates, time-averages, cumulative amounts, etc.) as well as the visual characteristics of each line (color, pattern, etc.) from the graph’s visual style. The style can be edited by selecting Edit Style from the chart’s command menu. For details on this dialog, see Labor Chart Style Dialog.
The toolbar shown in the upper left corner allows users to zoom in and out of the chart, and to change the viewing mode from ‘fit-to-window’ to ‘nominal’. For more details on the this toolbar, see Toolbar for All Time Charts.
If you move the mouse over a line charted the application will show on a a tooltip the actual operation(s) that contribute to the value shown. This can be particularly useful when exercised over peaks so that you can quickly find out which activity is responsible for the resources peak demand.
If you select Edit Recipe Scheduling Info from the graph’s command menu (in multi-batch charts), you will be presented with the Recipe Scheduling Information Dialog that allows you to view and/or edit the recipe’s scheduling data (cycle time, cycle time slack, number of batches per year, etc.). If you exit this dialog by clicking on the OK button, SuperPro Designer will re-generate the chart to reflect any changes that may affect the chart’s contents. If you need to be reminded of the process scheduling information at all times while examining this chart, you can also choose Scheduling Summary from the chart’s command menu. This will put up a small popup window that will present (for viewing purposes only) the main scheduling descriptors of the recipe (cycle time, number of batches per year, etc.), see Recipe Summary Information Popup.
The chart’s contents can be exported and shared with other applications in several ways. The chart (as a picture) can be copied and pasted by selecting Copy } Copy Chart from the chart’s command menu then pasted in another application. Note that chart and its legend are copied with separate commands (to copy the legend chose Copy } Copy Legend from the same menu). You may prefer to save the chart as a meta-file (‘wmf’ format). For that, choose from the chart’s command menu, then select a file location where you wish to have the ‘wmf’ picture of the chart be saved. Note that saving the file in this format makes it easy to be imported in several locations (by several other reports, spreadsheets, etc.).
For information on the right click context menu of this chart, see Context Menu.