This dialog appears when you select Charts } Materials } Entering } Single Batch from the main menu of the application.
Before you view the chart, you will be presented with a dialog from where you must select:
1. The material (pure component or stock mixture) whose consumption you wish to track.
2. The material consumption origins that you wish to be included when collecting consumption rate data from all operations.
For more details on the options presented by this dialog, see Material Selection for Consumption Chart.
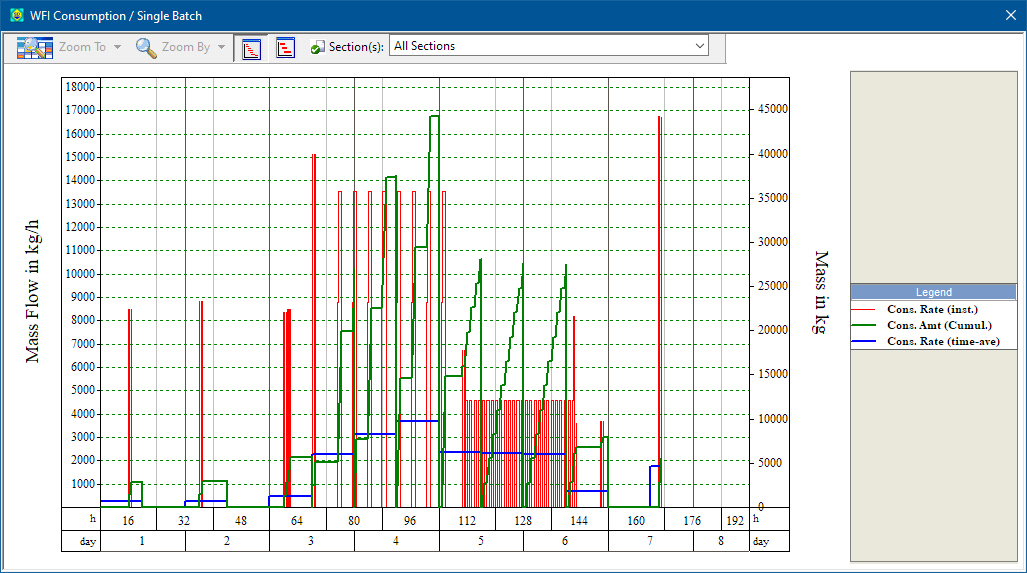
You can dictate which tracking lines to appear on the chart (actual consumption/output rates, time-averages, cumulative amounts, etc.) as well as the visual characteristics of each line (color, pattern, etc.) from the graph’s visual style. The style can be edited by selecting Edit Style from the chart’s command menu. For details on this dialog , see Material Chart Style Dialog
The toolbar shown in the upper left corner allows users to zoom in and out of the chart, and to change the viewing mode from ‘fit-to-window’ to ‘nominal’. For more details on the this toolbar , see Toolbar for All Time Charts.
If you move the mouse over a line charted the application will show on a a tooltip the actual operation(s) that contribute to the value shown. This can be particularly useful when exercised over peaks so that you can quickly which activity is responsible for the resources peak consumption.
If you select Edit Recipe Scheduling Info from the graph’s command menu (in multi-batch charts), you will be presented with the Recipe Scheduling Information Dialog that allows you to view and/or edit the recipe’s scheduling data (cycle time, cycle time slack, number of batches per year, etc.). If you exit this dialog by clicking on the OK button, SuperPro Designer will re-generate the chart to reflect any changes that may affect the chart’s contents. If you need to be reminded of the process scheduling information at all times while examining this chart, you can also choose Scheduling Summary from the chart’s command menu. This will put up a small popup window that will present (for viewing purposes only) the main scheduling descriptors of the recipe (cycle time, number of batches per year, etc.), see Recipe Summary Information Popup.
The chart’s contents can be exported and shared with other applications in several ways. The chart (as a picture) can be copied and pasted by selecting Copy } Copy Chart from the chart’s command menu then pasted in another application. Note that chart and its legend are copied with separate commands (to copy the legend chose Copy } Copy Legend from the same menu). You may prefer to save the chart as a meta-file (‘wmf’ format). For that, choose from the chart’s command menu, then select a file location where you wish to have the ‘wmf’ picture of the chart be saved. Note that saving the file in this format makes it easy to be imported in several locations (by several other reports, spreadsheets, etc.).
For details on each command of the right click context menu of this chart see the following table:
|
Set Number of Batches or Time Horizon |
Allows you to set the number of batches that you wish to be included in the chart. This option is only available if the multiple batches chart is being displayed. If the process is continuous and it contains batch procedures then only the Set Time Horizon option is displayed. |
|
Edit Recipe Scheduling Info |
Allows you to edit the recipe scheduling information. This menu option is only available if you are displaying multiple batches. |
|
Change Resource |
Will give you the option to change the resource being charted, through a menu with all the available resources that apply to this chart. (Pure Components or Stock Mixtures entering the process for the material demand chart, Heat Transfer Agents used for the heat transfer agent demand chart, etc) |
|
Fit to Window |
Switches between Fit-to-Window and regular drawing mode for the chart. When in Fit-to-Window mode, the entire time line is scaled down to fit in the available window width. |
|
Zoom In |
Will expand the drawing of the time line to allow user to view more details. Available only if Fit-to-Window mode is turned off. |
|
Zoom Out |
Will compress the drawing of the time line to allow user to view less details but more of the chart. Available only if Fit-to-Window mode is turned off. |
|
Supply Info |
Available in Inventory Charts only. Will present a dialog that allows the user to view and/or edit parameters related to the supply side of this resource (see Entering or Exiting Material Dialog: Inventory Data tab) |
|
Edit Style |
Present a dialog that allows you to edit the style of this resource tracking chart. |
|
Copy Chart |
Copies the entire chart to the clipboard. |
|
Copy Legend |
Copies the legend to the clipboard. |
|
Export Chart as Metafile |
Will save the chart image as a windows metafile (wmf). |
|
Excel Link |
Will export all the consumption and/or scheduling data contained in the chart to a Linked Excel file (Exporting Chart’s Data). |
|
Edit Recipe Scheduling Info |
Allows you to edit the recipe scheduling information. This menu option is only available if you are displaying multiple batches. |
|
Scheduling Summary |
Will show (if it’s not already visible) or hide (if it’s currently visible) the scheduling summary popup window for the active recipe. |
|
Zoom Toolbar |
Hides or Shows the zoom toolbar |
|
Print Chart |
Prints the active chart. |
|
Print Preview |
Displays the chart on screen as it would appear printed. |