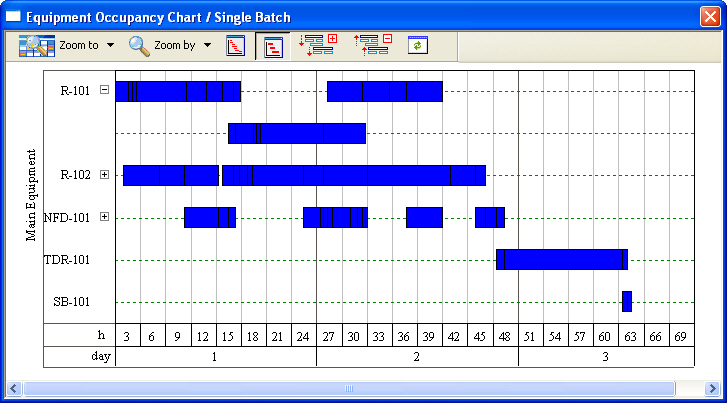
This interface appears when selecting the Charts } Equipment Occupancy} Single Batch option from the main menu
Every set of horizontal activity bars in the y-axis represents one of the main equipment resources (R-101, R-102, etc.), or an auxiliary equipment (e.g. a CIP Skid) involved in the execution of the current recipe. The x-axis presents a time line. For each equipment resource (y-entry) there may be one or more bars displayed. Each bar represents a distinct procedure that utilizes that resource as a host during its execution. Note that occasionally, there may be a long idle time between uses of the same equipment by two different procedures. For instance, assume that a vessel is hosting two procedures, one during the early stages of the recipe and another during the later stages of the recipe. The idle time between procedures is counted as waiting time for that equipment resource.
|
|
When the mouse moves hovers over a bar shown in the Equipment Occupancy chart, a tooltip will be presented showing the name of the procedure represented by the bar under the mouse. If you want the names of the procedures to show printed o the bars, please visit the chart’s style dialog, see Equipment Occupancy Chart Style Dialog. |
There are several aspects of the chart that can be modified to suit the user’s preferred view. The actual contents of the chart (entries in the y-line) can be dictated b the user (just the main equipment, or just auxiliary equipment or both); just double-click on the y-axis, see Equipment Occupancy Chart Style: Contents Tab. The order of appearance is also editable. It follows the standard equipment order kept by the process object but it can also be edited directly from this chart (select Include/Exclude/Order Equipment from the chart’s command menu). The time line’s minor and major tickmarks can be adjusted; just double-click on the time axis, see Graph Style Dialog (All Time Charts): Time Line Tab.
The horizontal bars, by default, represent each operation in each cycle (if there are more than one) in a procedure. If desired, the chart can lump all operations in a cycle into a single activity bar so all operations are abstracted into cycles, see Equipment Occupancy Chart Style: Contents Tab.
Typically the chart will come up in the ‘Fit-to-window’ viewing mode where all activity bars are showing simultaneously in one window width (no horizontal scrolling necessary). You can switch out from this view to the ‘Nominal Viewing’ mode (using the toolbar, see Toolbar for All Time Charts) or you can zoom by any percentage you wish or to any time-span that you chose (week, day, etc.)Zooming / Time Scale. The chart can either be printed , see Print/Print Preview or exported (as a picture) in order to be included in other Windows applications, see Copying / Exporting Chart As Picture. Finally, the chart’s scheduling data can also be exported into an Excel-compatible format (in case they need to be imported and manipulated further), see Exporting Chart’s Data. All of the above actions can be initiated by right-clicking on an empty area of the chart, and thereby invoking the chart’s command menu.
If you right-click over an activity bar a special command menu will appear:
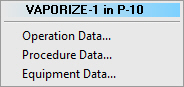
The first line is not a real menu item but simply mentions the name of the activity (operation, cycle, procedure etc.) Selecting Operation Data from the menu will bring up the i/o simulation dialog of the operation under the bar. Selecting Procedure Data is equivalent to selecting Procedure Data from the procedure’s icon command menu and will bring up the procedure dialog. Finally, selecting Equipment Data is equivalent to selecting Equipment Data from the procedure icon’s command menu, and will bring up the equipment dialog. If you edit any data values in any of those dialogs and exit with OK, then the contents of the displayed chart may not reflect your most recent changes. Instead of updating the chart every time you exit a data dialog, the application will only update the chart upon your command. You can redo the M&E balances, the scheduling calculations and refresh the contents of the chart by clicking on the Refresh button ( ) of the chart’s toolbar.
If you select Edit Recipe Scheduling Info from a multi-batch chart’s command menu (right-click over an unoccupied area of the chart), the Recipe Scheduling Information Dialog appears; it allows you to view and modify data related to the scheduling of the entire process (e.g. annual operating time, recipe cycle time, cycle time slack, etc.). This is the same dialog that appears when selecting Tasks } Recipe Scheduling Info from the application’s main menu. If you make any modifications to the data on this dialog and exit with OK, you will need to click on the Refresh button ( ) of the chart’s toolbar in order to have the M&E balances and the scheduling calculations be redone and the chart updated.
At any time you can have the scheduling summary window appear on top of this interface, see Recipe Summary Information Popup. This window is for display purposes only and it can be hidden at any time by clicking on its top-right corner. It may be useful to view as a monitor of the impact on the overall process scheduling of any changes made to the underlying activities.
If more than one procedures are scheduled (inadvertently) to occupy the same main equipment resource at the same time, it creates a conflict. Conflicts also appear in auxiliary equipment (like CIP skids) where operations (of the same batch ID or different batch IDs) may be inadvertently scheduled to occupy the equipment at the same time. Since conflicts imply bars ovelapping each other, it is virtually impossible to be viewed on the single-line view adopted by the equipment occupancy chart. For this reason, the application will display a ‘+’ symbol next to the y-axis entry of an equipment resource that has a recorded conflict of occupancy.
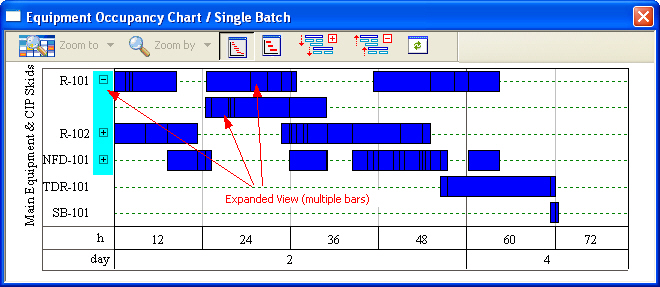
Clicking on the ‘+’ sign will expand the bar that contains conflicts into as many rows as necessary to display the conflicts clearly. You can later collapse the equipment line that shows the conflicts back into a single line by clicking on the ‘-’ sign now displayed next to the equipment’s name. As a shortcut to expanding all lines of equipment that have conflict you can click on the Expand All Conflicts button ( ) of the chart’s toolbar. Reversely, the Collapse All Conflicts button (
 ) of the chart’s toolbar collapse all such lines.
For details on each command of the right click context menu of this chart, see the following table:
|
Set Number of Batches or Time Horizon |
For multiple batches charts only. It allows you to set the number of batches you wish to be included in the chart, or the size of the time horizon you want to display in the chart. For continuous processes containing batch procedures steps you can only set the time horizon. |
|
Fit to Window |
Switches between Fit-to-Window and regular drawing mode for the chart. When in Fit-to-Window mode, the entire time line is scaled down to fit in the available window width. |
|
Zoom In |
Will expand the drawing of the time line to allow user to view more details. Available only if Fit-to-Window mode is turned off. |
|
Zoom Out |
Will compress the drawing of the time line to allow user to view less details but more of the chart. Available only if Fit-to-Window mode is turned off. |
|
Edit Style |
Present a dialog that allows you to edit the style of this resource tracking chart. |
|
Include / Exclude / Order Equipment |
Will bring up a dialog that allows you to choose which equipment to include /exclude in/from the chart and also set their order of appearance in the chart. |
|
Copy Chart |
Copies the entire chart to the clipboard. |
|
Copy Legend |
Copies the legend to the clipboard. |
|
Export Chart as Metafile |
Will save the chart image as a windows metafile (wmf). |
|
Excel Link |
Will export all the consumption and/or scheduling data contained in the chart to a Linked Excel file (Exporting Chart’s Data) |
|
Edit Recipe Scheduling Info |
Allows you to edit the recipe scheduling information. This menu option is only available if you are displaying multiple batches. |
|
Scheduling Summary |
Will show (if it’s not already visible) or hide (if it’s currently visible) the scheduling summary popup window for the active recipe. |
|
Zoom Toolbar |
Hides or Shows the zoom toolbar |
|
Print Chart |
Prints the active chart. |
|
Print Preview |
Displays the chart on screen as it would appear printed. |
