 of the chart’s toolbar. Note that since this command will re-run the simulation, it may result in the display of several simulation error and/or warning messages generated during simulation.
The operations gantt chart presents an overview of the entire schedule for a single or multiple batches as a Gantt chart. To display the Operations Gantt Chart (Single Batch), select Charts } Gantt Charts } Operations GC. To display the Operations Gantt Chart (Multiple Batches), select Charts } Gantt Charts } Operations GC (Multiple Batches). Multiple batches may be of interest when there is batch overlapping (i.e. the second batch starts before the first batch, or in other words when the cycle time is less than the batch time).
There are two types of bars in the chart:
● Activity Summary Bars, representing a composite activity, i.e. an activity that can be expanded or refined to other activities, e.g., a procedure.
● Elementary Activity Bars, representing a single, non-expandable activity, e.g. an operation in a cycle.
There are seven levels of activities considered by the operations Gantt chart. Those levels in order of hierarchy are as follows:
1. Batch
2. Branch
3. Section
4. Procedure
5. Cycle
6. Operation
Each task (activity) bar in the above hierarchy expands into subtasks of the level below. Since branches and sections may not often be used in a process simulation, their levels can be optionally skipped; in that case, batch-level activity bars expand directly into procedure bars. You can edit the style of the chart through the Operations Gantt Chart Style Dialog. Different levels can be selected or omitted through the Operations Gantt Chart Style Dialog: Contents Tab. Each bar has its own visual style that can be customized by the user. Users may also find it convenient to display next to each task bar a short description of the activity represented by the bar. You can turn on or off the textual description (perhaps only for certain types of activities, e.g. operations only) by modifying each activity’s style.
The operations Gantt chart interface window is divided into two views:
a) the spreadsheet view (left). The spreadsheet view displays in each line the name, duration, start and end time for each activity whose bar line is shown straight across on the chart (all information is presented for viewing purposes only). You use the left view to expand and/or collapse activity summaries by clicking on the + or - buttons showing at the left of the activity name.
b) the chart view (right). The chart view displays, as a horizontal bar drawing against the time line, each activity participating in the overall scheduling of the recipe. Right-click on a bar and a relevant command menu will come up. Selecting the first menu entry will bring up a dialog that will allow you to edit scheduling information associated with that particular activity bar. At any time you can request to have the M&E balances redone and to have the Gantt chart updated to reflect the new (calculated) scheduling settings for the recipe. Simply click on the Update Chart entry in the main menu of the interface or click on the Refresh button of the chart’s toolbar. Note that since this command will re-run the simulation, it may result in the display of several simulation error and/or warning messages generated during simulation.
When you are done working with the Gantt chart interface, you can close it down by selecting the File } Exit option from the main menu or simply click on the  button (top-right).
When a multi-batch chart is chosen to be shown, the default number of batches (NB) shown at first is calculated as follows:
NB = 1 + [RBT / RCT], where
[RBT/RCT] is the rounded up integer ratio of the recipe’s batch time (RBT) divided by the recipe’s cycle time (RCT). The number is chosen this way, so that even if you later view a larger number of batches, all future batch graphs will always have a pattern that can be mapped within this chart (with some offset). In other words, NB as calculated above, is the minimum number of batches necessary to plot such that it will capture all possible batch interactions. Of course the number of batches can later be set to any number (select Set Number of Batches or Time Horizon from the chart’s command menu).
SuperPro Designer uses a default coloring scheme for presenting all the occupancy bars belonging to the same batch. This makes it very easy to visually convey the batch number for each activity (task) bar. The legend window at the side of the chart indicates which color has been chosen for each batch ID. The user can modify the color to be used for a given batch ID by simply double clicking on its color sample in the legend window.
The x-axis represents time. By default, the axis start time is 0.0. In other words, the time value of ‘0.0’ is assigned to the earliest engagement of an equipment (aka beginning of the batch). If so desired, a real date/time can be assigned through the Graph Style Dialog (All Time Charts): Time Line Tab. The time axis displays two lines with increments of time: minor and major. The settings for what time increment to be used for major and minor increments as well as what units to be displayed is also customizable. By default a vertical grid line will be displayed on both minor and major increments but they can be turned off is so desired.
You can print (or print preview) a chart directly from SuperPro Designer by selecting the Print (or Print Preview) command from the chart’s command menu. If the printing quality is not adequate, or more printing options are desired (e.g. smarter scaling, etc.) then it is recommended that you export the chart as a picture into another application first (e.g. MS-Excel®) and then print it.
From the operations Gantt chart interface (single or multiple batches) you can access all scheduling and most simulation data for the entire recipe. When utilized in this way, this interface becomes an alternative way to view and work with your recipe. To access the data, you must right-click over a chart's bar, and select the first entry from the command menu that pops up. The menu entry and the ensuing dialog depend on the type of bar you started:
For recipe (batch) summary bars: the Recipe Scheduling Information Dialog allows you to edit the recipe-level scheduling data (annual operating time, number of campaigns, etc.)
For branch summary bars: the Branch Properties Dialog presents all branch properties.
For section summary bars: the Section Properties Dialog presents all section properties.
For procedure summary bars: the Procedure Data Dialog allows you to change the number of cycles for that procedure.
For procedure cycle summary bars: the Cycle Description Dialog presents some cycle-related information (for viewing purposes only).
For operation elementary activity bars: the Operation i/o Simulation Dialog is the same as the dialog that you view from the main interface of SuperPro Designer. It allows you to edit the operating conditions as well as the scheduling settings for that operation.
|
|
All changes made through any dialogs invoked during the time the Gantt chart interface is active, are permanent and cannot be reversed (even if you exit the chart by clicking on the |
You can copy the chart (as a picture) by selecting Copy } Chart and its legend by selecting Copy } Legend (the latter only available in multi-batch charts). Then, you can go to another application (e.g. MS-Word®, or MS-Excel®) and issue a paste command. This will paste the chart (or the legend) as a picture in the destination document. Another way of exporting the chart (as a picture) is to save it in a Windows Metafile (‘wmf’) format in a file and later import the picture file into another application. You can export the chart picture in Windows Metafile Format by selecting Export Chart as Metafile from the chart’s command menu.
You can copy the Gantt spreadsheet and paste it into other applications as a table (e.g. in MS-Excel®, MS-Word®, etc.) This can be done by right-clicking on the Gantt spreadsheet area and selecting Copy Gantt Spreadsheet from the ensuing menu.
The chart’s scheduling data can be exported in a tabular format that can be readily imported into MS-Excel® for further processing / plotting etc. You can select Export Data to Excel from the chart’s command menu and then provide a file name and location, and SuperPro Designer will include the data into the selected file.
You can export all the scheduling information into MS-Project® by selecting File } Export to MS Project XML File... from the menu of the Gantt chart interface. The exported xml file can then be opened in MS-Project®.
► To import scheduling data into MS Project® (MS Project® 2000 or higher)...
1. Start MS Project® and select File } Open
2. From the ‘Open File’ dialog make sure the ‘*.xml” files are shown. Select the exported xml file generated from SuperPro Designer.
3. After selecting the above ‘xml’ file to open, you will see the following interface:
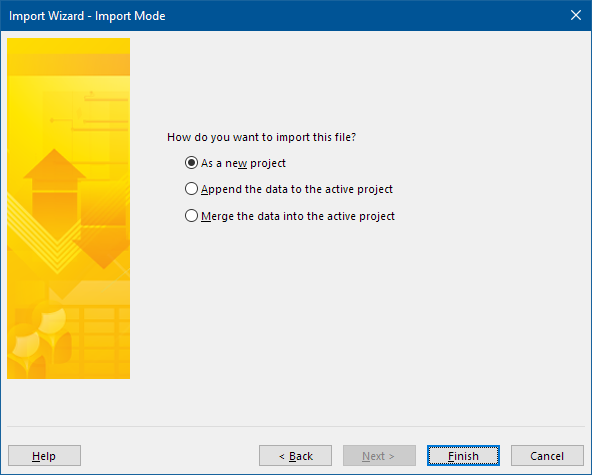
4. Select to open the file ‘As a New Project’ (first choice above) and then click on ‘Finish’.
5. MS-Project will create a complete project and gantt chart after the dialog is closed.
SchedulePro is a separate application developed and marketed by Intelligen that handles scheduling and debottlenecking of single and multi-product facilities in detail. Recipes developed in SuperPro Designer can be readily exported to SchedulePro by selecting File } Export to SchedulePro Recipe DB... from the application’s main menu. The recipe data are deposited into a ‘Recipe Database’ and from there they can be readily imported into SchedulePro. Once imported into SchedulePro users can have a wider flexibility in building single or even multi-product (sharing the same site) campaigns.
The time axis can be either stretched out (in order to view more details of the chart), or condensed in order to manage to fit the chart in a smaller visible region. The three factors that determine how much of the chart will be visible in a given window space are:
6. The viewing mode
7. The time scale chosen for minor & major increments, and
8. The zooming factor
There are two viewing modes: Fit-to-Window and Nominal. When the graph viewing mode is set to ‘Fit-to-Window’ (the  button is pressed) the application will display the graph’s contents always in the available window width. In this mode, a user can gain an overall perspective of the entire graph, at the expense of missing small details. When the chart is viewed in this mode, it is possible that not all of the major and/or minor increments of time can be individually visible. Sometimes, the increments will be melded into two, or three or more at a time, in order for the labels to fit and in order for the entire time span to fit in the available space. In this mode priority is given to displaying the entire graph within the allotted space. In the ‘Nominal’ viewing mode (the
  button is pressed) the application decides the scale by which to display the occupancy information in a way that the user’s selection for minor increments is obeyed. In other words, in this mode, all the minor increments are displayed, more than likely requiring more horizontal space than what is available in a single window width, so a horizontal scroll is now visible. In that mode, you can further increase or decrease the zooming factor by using the Zoom to button (
 ) or the Zoom by button (
 )of the toolbar. The Zoom to option will pick a zoom factor such that the chart’s window will display exactly the selected span of time (a day, a month, etc.). The Zoom by option simply increases or decreases the zooming ratio by the selected percentage, thereby allowing more or less details to be visible on the graph. You can also zoom in and out by selecting the corresponding commands in the chart’s command menu.
|
|
The zoom in/out and zoom to/by commands and/or buttons on the toolbar are only active if the viewing mode is set to ‘nominal’. When viewing the chart in the ‘fit-to-window mode’, the scale is automatically picked to make sure that the chart fits in the available space. |
The visual appearance of a Gantt chart can be modified through the Operations Gantt Chart Style Dialog. To access that dialog, you can either select Preferences } Styles } Gantt Chart from the Gantt Chart main menu, or Styles } Chart & Grid from the flowsheet context menu.

 button (top-right).