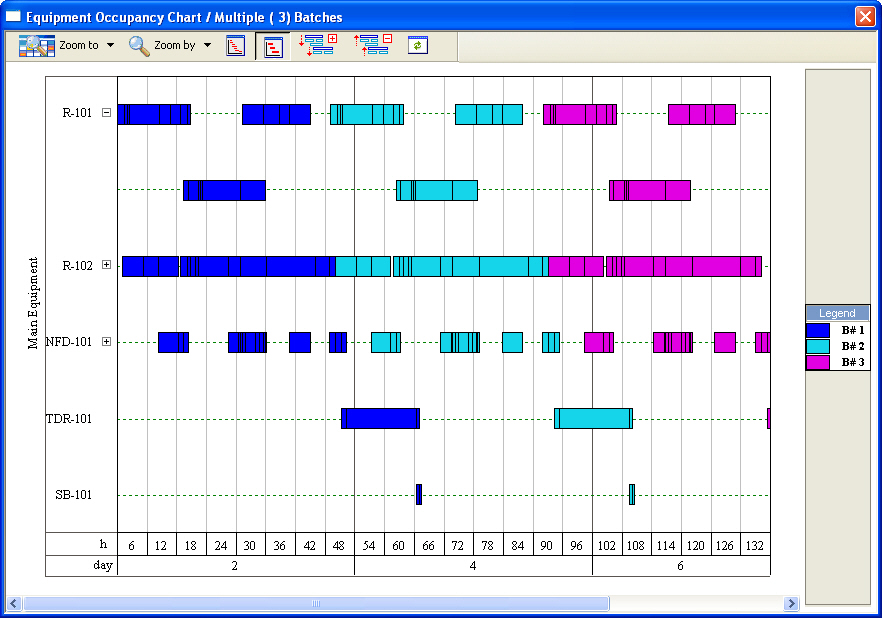
This interface appears when selecting the Charts } Equipment Occupancy} Multiple Batches option from the main menu
For a description of the basic functionality of the graph, see Equipment Gantt Chart (Single Batch).
When a multi-batch chart is chosen to be shown, the default number of batches (Nb) shown at first is calculated as follows:
Nb = 1 + [BT / CT], where
[ BT/RCT] is the rounded up integer ratio of the recipe’s batch time (BT) divided by the recipe’s cycle time (CT). The number is chosen this way, so that even if you later view a larger number of batches, all future batch graphs will always have a pattern that can be mapped within this chart (with some offset). In other words, Nb as calculated above, s is the minimum number of batches necessary to plot such that it will capture all possible batch interactions. Of course the number of batches can later be set to any number (select Set Number of Batches from the chart’s command menu).
The application uses a default coloring scheme for presenting all the occupancy bars belonging to the same batch. It makes it very easy to visually convey the batch number for each activity (task) bar. The legend window at the side of the chart indicates which color has been chosen for each batch ID. The user can modify the color to be used for a given batch ID by simply double clicking on its color sample in the legend window.
The same coloring scheme sequence is also followed by equipment used by batch procedures which do not have the same cycle as the main batch or by equipment used by batch procedures executed in a continuous process (See also Procedure Cycle and Cycle Duration). Furthermore on the chart the equipment hosting procedures which cycle independently from the main recipe are indicated with (i/c).
The application uses a default coloring scheme for presenting all the occupancy bars belonging to the same batch. This makes it very easy to visually convey the batch number for each activity (task) bar. The legend window at the side of the chart indicates which color has been chosen for each batch ID. The user can modify the color to be used for a given batch ID by simply double clicking on its color sample in the legend window.
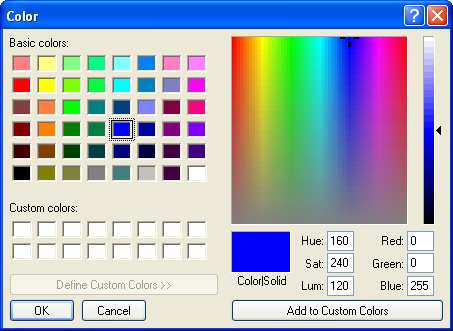
The dialog above will appear. Select a new color and click on OK. All activity bars of that batch ID will be shown filled in with the chosen color and the legend will also reflect the changed color.
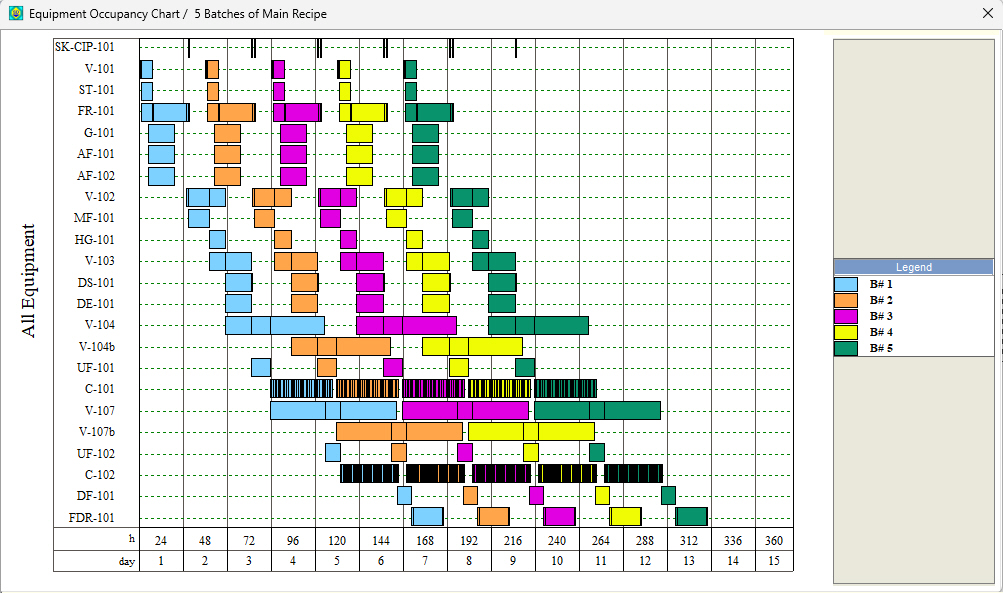
If one chooses, the application can use an alternate coloring scheme based on the type of each operation and the group it belongs. For example, users can opt to create a group “Filtrations” that will include all filtration-type operations (Concentration, Diafiltration, Ultrafiltration, Nutsche Filtation, etc.) and another group named “Transfers” that includes all transfer operations (e.g. “Transfer In”, “Charge” “Pull in”, “Transfer Out”, etc.). and assign a color (e.g. green) to the “Filtrations” group and red to all “Transfers”.
If that is the case then an EOC that is showing activities for 5 batches with regular color coding (based on batch number) would be Transfer Out”, etc.). and assign a color (e.g. green) to the “Filtrations” group and red to all “Transfers”. When the regular coloring scheme is applied then the chart shows as follows:
However, when the user elects to have the activities shown based on their activity (operation) group then the same chart appears as follows:
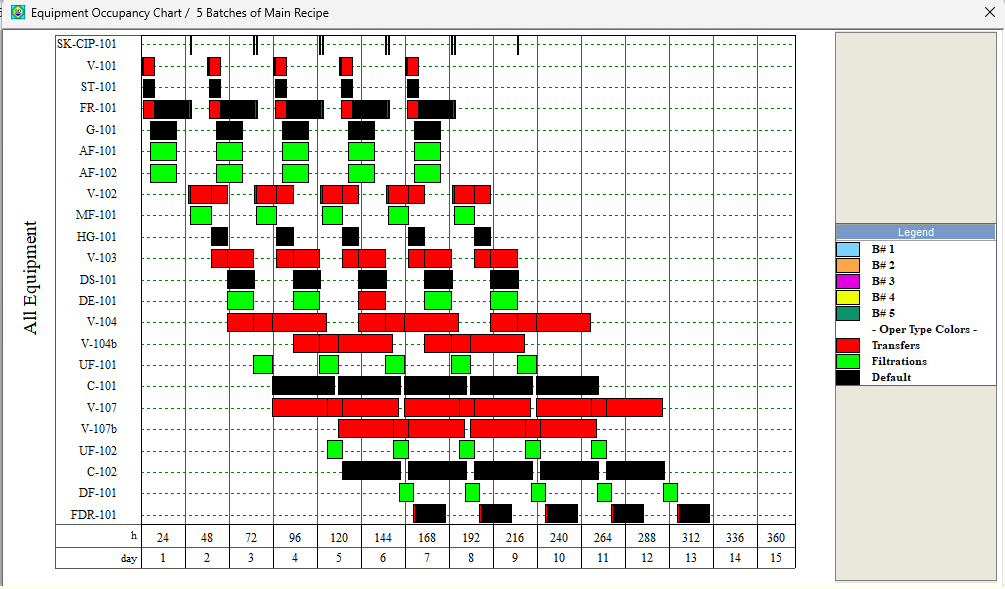
To decide which color scheme to be used for the chart, please see Graph Style for Equipment Occupancy Data Chart. You can define Operation Groups and assign colors to them by selecting Tasks } Operation Type Groups from the main menu which will bring you the Operation Group Definition Dialog see Operation Type Group Dialog.