
For a detailed analysis of this example process using the above SuperPro Designer files, please refer to readme file ‘Bgal.doc’ that can be found in the same directory as the SuperPro Designer files.
This example analyzes the production of β-Galactosidase, an intracellular enzyme produced by E.coli. This example is recommended for users in the biotech and food industries. In addition, since this example is a batch process, it serves as a medium for discussing several scheduling issues. Please, see Process Description for more details on this process.
The process file and readme files for this example can be found in the ‘Examples\Bio-Material\BGal’ directory of SuperPro Designer. The following process files are included:
1. BGal_10a: This file represents the process at an early stage of plant design. All equipment is in ‘Design Mode’, meaning that all equipment sizes and throughputs are calculated as opposed to being specified by the user.
2. BGal_10b: This file represents the process after equipment sizes have been specified for key pieces of equipment.
3. BGal_10c: This file is the same the previous one, except that final product formulation and packaging unit procedures have been added.
|
|
For a detailed analysis of this example process using the above SuperPro Designer files, please refer to readme file ‘Bgal.doc’ that can be found in the same directory as the SuperPro Designer files. |
The β-Galactosidase (b-Gal) is an intracellular enzyme produced by E.coli. This enzyme has found limited industrial applications until now. It is mainly used in the utilization of cheese whey. More specifically, immobilized reactors with b-Gal have been developed to convert lactose found in cheese whey to glucose and galactose, yielding a sweetened product which can be used as an additive to ice cream, egg-nog, yogurt, and other dairy products. Another application of b-Gal is in the treatment of milk products. A significant number of people are lactose intolerant and cannot digest milk or milk products. Production of lactose-free milk products (using b-Gal reactors) allows those people to digest them.
The description that follows refers to file ‘BGal_10b’. At this point, we suggest that you open this file and examine it briefly. We suggest that you keep the file open as you read the remainder of this section. This example analyzes a plant that produces 18,515 kg of b-Gal per year in 216 batches. This enzyme is normally produced by E. coli up to 1-2% of total cell protein under conditions of induction of the lac operon. Using genetic engineering, the level can go up to 20-25% of total protein. In this example, an easily attainable level of 10% is assumed.
The corresponding flowsheet for this process is shown in The β-Galactosidase process flowsheet.. This process has been divided into three sections:
1. ‘Fermentation’ (black icons),
2. ‘Primary Recovery’ (blue icons), and
3. ‘Purification’ (green icons).
The concept of process sections was introduced to facilitate reporting of results for costing, economic evaluation, raw material requirements, and throughput analysis of integrated processes. A process section is a group of unit procedures that have something in common; for more details on process sections, see Specifying Process Sections.
The process steps associated with each section of the example process are described below.
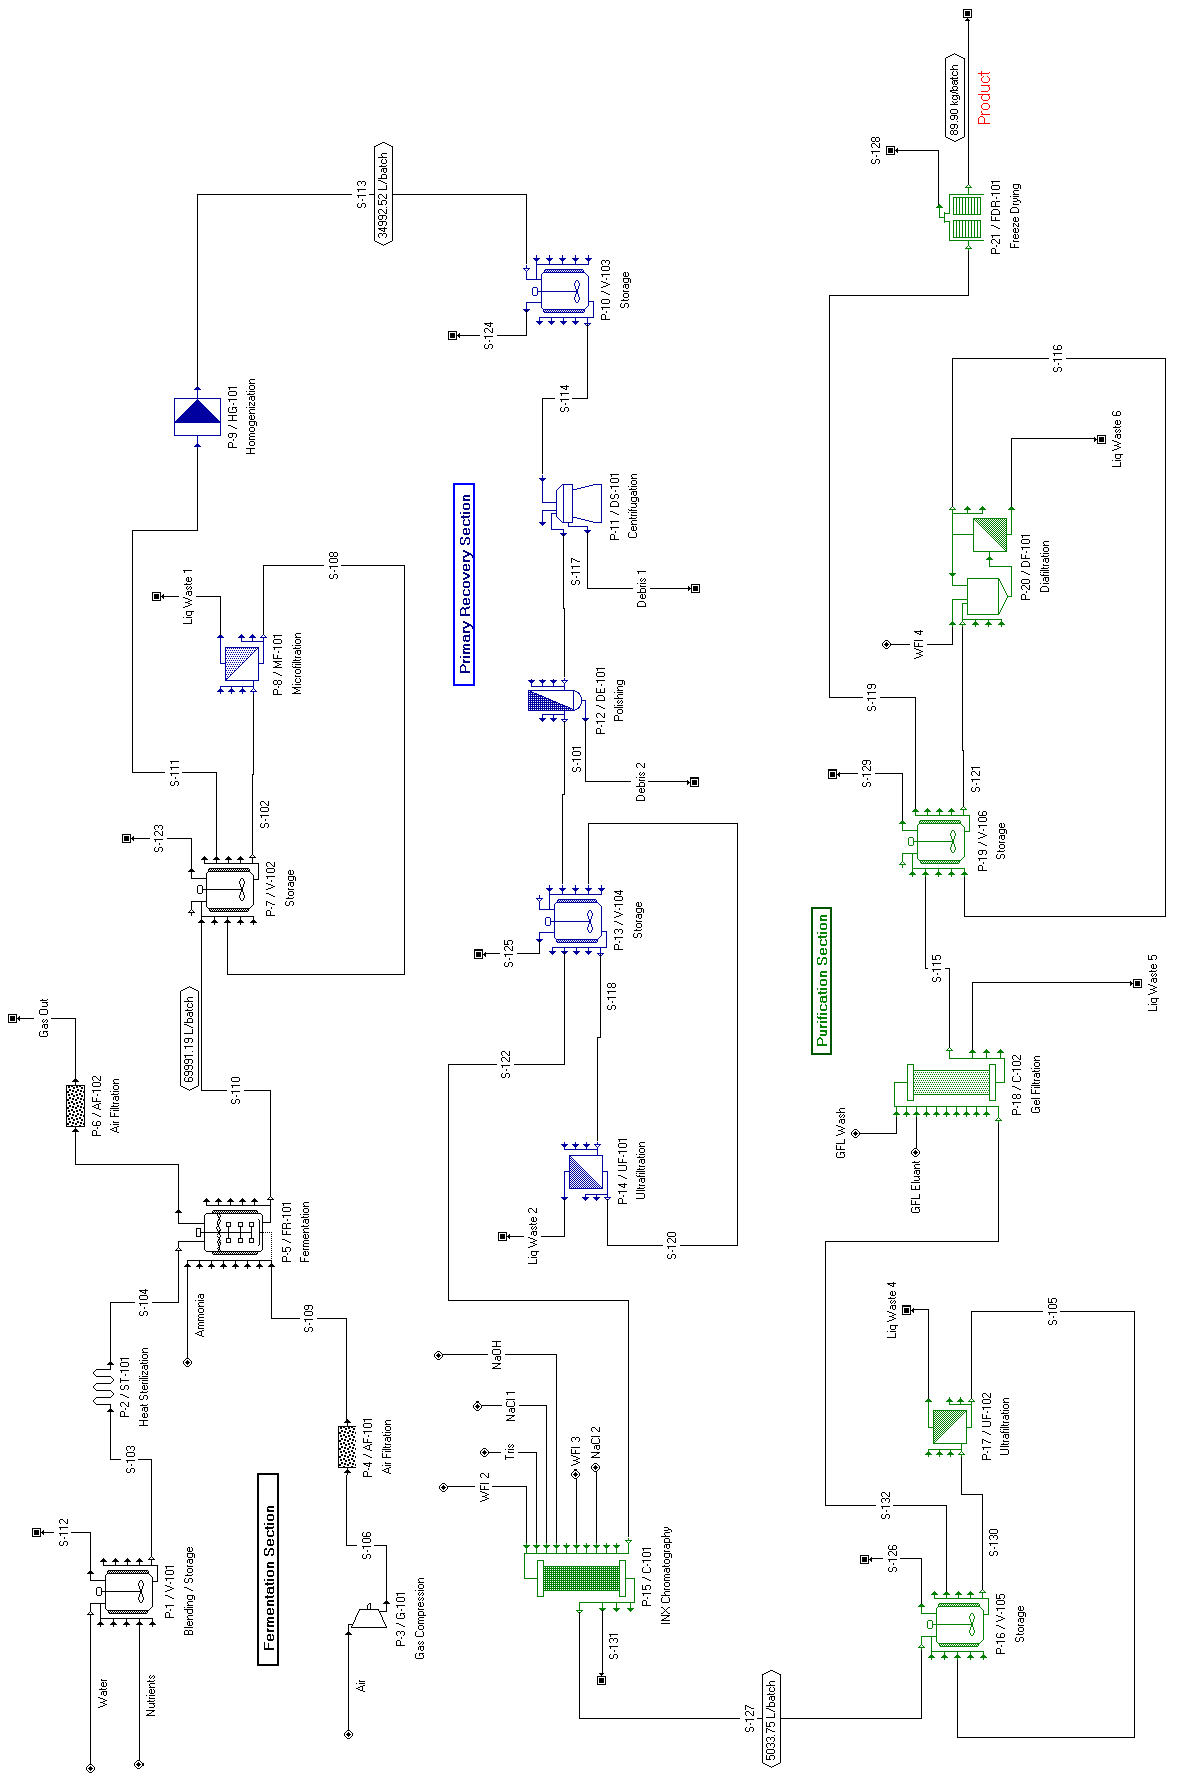
The β-Galactosidase process flowsheet.
Fermentation media are prepared in a stainless steel tank (‘P-1/R-101’) and sterilized in a continuous sterilizer (‘P-2/ST-101’). A compressor (‘P-3/G-101’) and an absolute air filter (‘P-4/AF-101’) provide sterile air to the fermentor (‘P-5/FR-101’). Gaseous ammonia is used as a nitrogen source for fermentation.
The first step of the primary recovery section is cell harvesting to reduce the volume of the broth and remove extracellular impurities. It is carried out by a membrane microfilter (‘P-8/MF-101’). Since b-Gal is an intracellular product, the next important step is cell disruption, performed in a high-pressure homogenizer (‘P-9/HG-101’). After homogenization, a disk–stack centrifuge (‘P-11/DS-101’) is used to remove most of the cell debris particles. A dead-end polishing filter (‘P-12/DE-101’) removes the remaining cell debris particles. The resulting protein solution is concentrated two-fold by an ultra-filter (‘P-14/UF-101’), and stored in a blending tank (‘P-13/V-104’).
Next, the product stream is purified by an ion exchange chromatography column (‘P-15/C-101’). Then, it is concentrated three-fold by a second ultra-filtration step (‘P-17/UF-102’) and polished by a gel filtration column (‘P-18/C-102’). Finally, a diafiltration unit (‘P-20/DF-101’) exchanges the gel filtration buffer, and the protein solution is lyophilized in a freeze dryer (‘P-21/FDR-101’).
To cut the cycle time of a batch process, it is common to utilize multiple equipment items operating in staggered mode (i.e., alternating from batch-to-batch) for steps (procedures) that have long cycle times. That’s the case with steps ‘P-13/V-104’, ‘P-16/V-105’ and ‘P-19/V-106’ of this process. Notice that a staggered equipment indicator ( ) is shown at the bottom left corner of the corresponding procedure icons to indicate that the above steps use staggered equipment. Those steps (involving storage tanks) have long cycle times because they receive material from previous steps and feed subsequent steps. If we employ two tanks for each of those steps that alternate from batch to batch, we can cut their cycle times in half. This is specified through the ‘Stagger Mode’ box that can be found in the ‘Equipment’ tab of a unit procedure’s ‘Equipment Data’ dialog. This tab is shown in The Equipment tab of a storage vessel. for step ‘P-13/V-104’. If the number of units in a single set is “1”, then specifying “1” or “2” extra set(s) of equipment units in stagger mode is equivalent to creating a pool of two or three equipment items that can alternate in use.
The impact of the use of staggered equipment can be visualized by looking at the Equipment Occupancy Chart (The Equipment Occupancy Chart for five consecutive batches.) for this process. Tank ‘V-104b’ is the alternate of tank ‘V-104’ for step ‘P-13’. The first batch (blue color) is handled by ‘V-104’, whereas the second batch (cyan color) is handled by ‘V-104b’. The two tanks continue to alternate in subsequent batches. The same happens with tanks ‘V-105’ and ‘V-105b’ for step ‘P-16’, and tanks ‘V-106’ and ‘V-106b’ for step ‘P-19’.
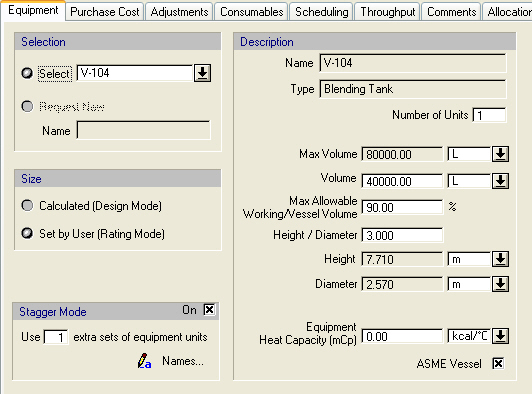
The Equipment tab of a storage vessel.
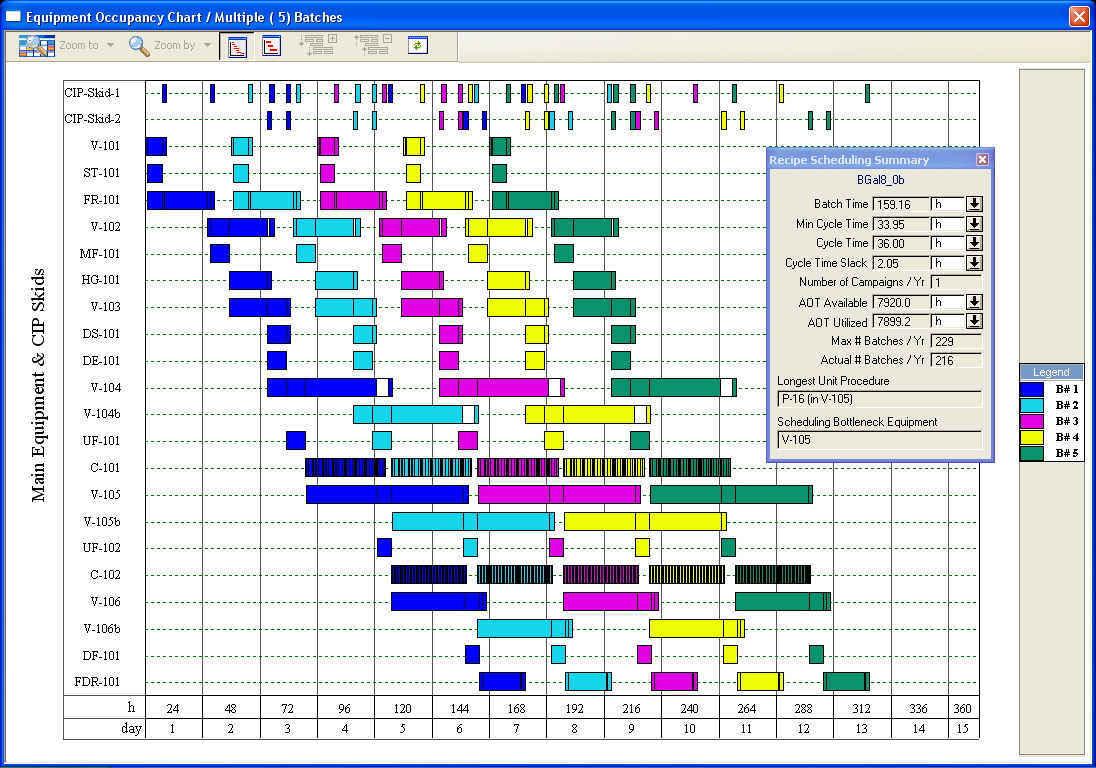
The Equipment Occupancy Chart for five consecutive batches.
The names of staggered equipment (e.g. ‘V-104b’) can be edited by clicking on the Names button in the ‘Equipment’ tab. For additional information on staggered equipment, see Staggered Mode. For more details on the Equipment Occupancy Chart, see Viewing Scheduling, Equipment Utilization and Resource Tracking Results.
In bioprocessing, we have formation of intracellular (i.e., inside the cell) as well as extracellular (i.e., released into the solution) products. To capture this, as well as the fact that biomass is usually reported on a dry-cell-mass basis, we use the concept of ‘Extra-Cell %’ in streams and fermentation reactions. The ‘Extra-Cell %’ of a component in an input stream (something fed into the system) or a product of a fermentation reaction (something generated in the system) can be specified only if the ‘Primary Biomass Component’ of the process is identified. This is accomplished through the pure component registration dialog (see The pure component registration dialog for the b-Gal example.). The ‘Primary Biomass Component’ is selected among components whose ‘Is Biomass ?’ flag has been set to true on the ‘ID’ tab of the corresponding ‘Pure Component Properties’ dialog; for more details on the pure component registration dialog, see Registering (Pure) Components and Mixtures.
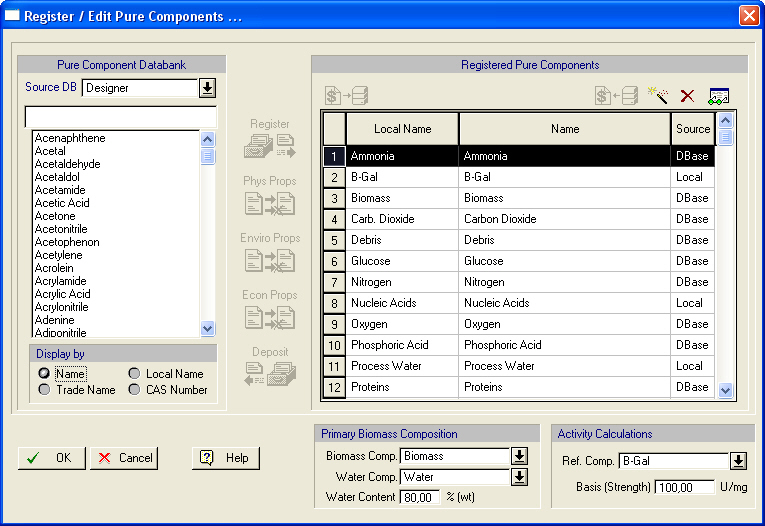
The pure component registration dialog for the b-Gal example.
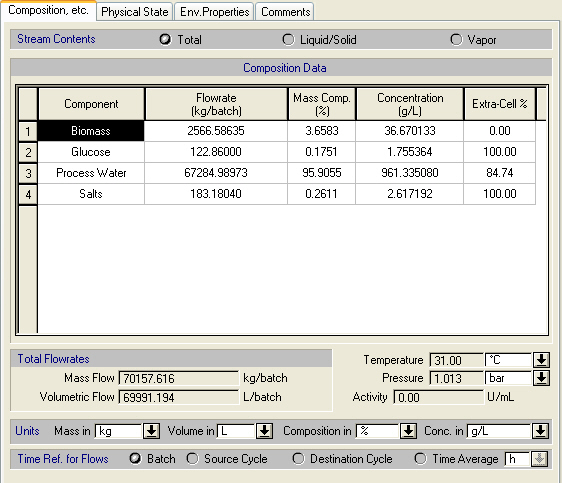
In this dialog, you can also specify the water content of the ‘Primary Biomass Component’. Here, water refers to the component that is selected as the ‘Water Component’ in the same dialog. If the primary biomass and water components are identified, and a positive value is specified for the water content of the primary biomass component, then, if there is formation of the primary biomass component (as a fermentation product) in the process, the program will automatically associate intracellular water with biomass in order to satisfy its water content, as specified during component registration. In other words, the intracellular amount of the water component in the fermentation product stream will be set equal to the specified value for the water content of the primary biomass component. This is displayed using an ‘Extra-Cell %’ value of less than 100% for the water component in the ‘Composition, etc.’ tab of the simulation data dialog for the fermentation product stream (see The ‘Composition, etc.’ tab of the simulation data dialog for fermentation outlet stream ‘S-110’.). This has an impact on material balances in separation procedures (e.g., centrifugation, clarification, filtration, etc.). If a removal percentage is assigned to the primary biomass component in these procedures, the program will use the same removal percentage for the intracellular portion of all components. This results in solids streams (e.g., retentate, concentrate, etc.) with concentrations closer to reality
.
The ‘Composition, etc.’ tab of the simulation data dialog for fermentation outlet stream ‘S-110’.
In addition, a fermentation reaction product can be identified as intracellular by specifying an ‘Extra-Cell %’ value of less than 100% in the ‘Stoichiometry Balance for Reaction’ dialog for that reaction. This dialog can be accessed through the ‘Reactions’ tab of a fermentation operation’s dialog. That component can become extracellular (released into the solution) using a cell disruption procedure (e.g., high-pressure homogenization or bead milling).
In bioprocessing, the concentration of a product or undesired impurity is often reported as activity measured using a certain assay. In SuperPro Designer, this is represented using the ‘Activity Reference Component’ and its activity ‘Basis’ which is expressed in U/mg. These can be specified through the pure component registration dialog (see The pure component registration dialog for the b-Gal example.). The activity basis represents how many (arbitrary) units of activity (U) correspond to each mg of the reference component present in a stream. This information is used to calculate and report the activity of a stream in U/mL. This concept is also applicable to other industries. For instance, in treatment of nuclear waste, the calculated stream activity may represent radioactivity.
Correct modeling of fermentation operations is important in biotech processes. SuperPro Designer is equipped with two different types of fermentation models (stoichiometric and kinetic) for batch, as well as continuous, fermentation reactions. The stoichiometric model is used if no kinetic data is available or if simplicity is desired, which is the case in this example. If kinetic data is available, the kinetic model can be used to calculate composition, temperature, and utility profiles as a function of time. Initialization of a stoichiometric fermentation is essentially identical to initialization of a stoichiometric chemical reaction, except that there is an option on the ‘Oper. Cond’s’ tab for fermentor aeration; for more details on the initialization of stoichiometric chemical reactions, see Initialization of Reaction Operations.
Note that all batch reactions have fed-batch capabilities and that a Perfusion fermentation operation is also available. For examples of kinetic, fermentation and fed-batch reaction models, please consult examples ‘BKinRxn’, ‘BKinFerm’ and ‘FedBR’, respectively. These can be found in the ‘Examples\Misc’ directory of SuperPro Designer.
As an alternative to adding explicit storage procedures to the process, you can specify implicit supply or receiving storage units which are not displayed graphically on the flowsheet. These units allow you to track material storage requirements in a process without further increasing its complexity. An example of using this feature is demonstrated in file ‘Bgal8_0b’. In this file, two receiving units (a biowaste tank and an aqueous waste tank) are employed for collecting waste. For more details regarding storage units and their application in this example file, please refer to the readme file for the b-Gal example.
At this point, you may want to change the values of certain parameters and redo the mass and energy balance calculations (click Solve ME Balances ( ) on the Main toolbar or on the Tasks menu, or simply hit Ctrl+3 or F9 on your keyboard).
You can view the calculated flowrate and composition of intermediate and output streams by visiting the simulation data dialog of each stream (double click on a stream, or right-click on a stream and select Simulation Data). Alternatively, you may use the ‘Stream Summary Table’ to view selected attributes (e.g., total flow, temperature and pressure) of selected streams. To show or hide the ‘Stream Summary Table’, click Stream Summary Table ( ) on the Main toolbar. Note that this table is empty when it is brought up the first time. To populate it, right-click on the table to bring up its context menu and select Edit Contents; for more details, see Process Analysis.
In addition, you can generate the ‘Streams & Material Balance (SR)’ report. To do this, click Streams & Mat. Balance (SR) on the Reports menu. This report contains information on the overall process, raw material requirements, stream compositions and flowrates, as well as an overall material balance. The bulk material s table of the Streams & Material Balance (SR) report. shows the bulk materials table of the SR report for this process; for more details on this report, see Process Analysis.
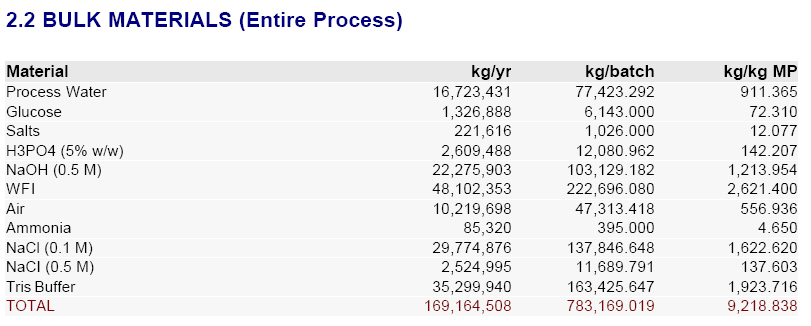
The bulk material s table of the Streams & Material Balance (SR) report.
You may also want to generate the Emissions Report (EMS) and the Environmental Impact Report (EIR) for this process. To do that, select Emissions (EMS) or Environmental Impact (EIR) on the Reports menu; for more details, see Environmental Impact.
For additional information on viewing simulation results, see Switching Unit Procedures.
SuperPro Designer generates the Operations Gantt Chart and the Equipment Gantt Chart that display scheduling and equipment utilization information, respectively, for single or multiple batches. From the Gantt chart interfaces, you can also modify the scheduling parameters of unit procedures, operations, equipment (in Equipment Gantt Charts only), as well as of the entire recipe, and immediately visualize the effects on the entire batch production. A portion of the Operations Gantt Chart for this example and for a single batch is shown in The Operations Gantt Chart for a single batch..
Another way of visualizing the execution of a batch process as a function of time is through the Equipment Occupancy Chart. This chart shows in a graphical way how long each equipment is kept busy by some operation and how long it is just idle during batch processing. As described in Specifying Staggered Equipment, this chart can also be used to visualize the impact of using staggered equipment. The Equipment Occupancy Chart for five consecutive batches. in that section displays the Equipment Occupancy Chart for five consecutive batches of this example process. Please generate this chart now. To view scheduling summary information for this process on the chart (as was done in The Equipment Occupancy Chart for five consecutive batches.), right-click on the chart to bring up its context menu and check Scheduling Summary. You may also access or modify the recipe scheduling information by selecting Edit Recipe Scheduling Info on the same menu.
The equipment with the least idle time between consecutive batches (or, equivalently, the longest occupancy time per batch) is the time (or scheduling) bottleneck (‘V-105’ in this case). This is the equipment that determines the maximum number of batches per year. Its occupancy time per batch (approximately 68 hours) would be the minimum cycle time (the minimum possible time between consecutive batch starts) if no staggered equipment were specified. However, in this example, we chose to operate the procedure with an extra piece of equipment (‘V-105b’) for ‘V-105’ in stagger mode. Having an extra piece of equipment in stagger mode reduces the minimum cycle time by a factor of two. Therefore, the minimum cycle time for this example is approximately 34 hours; for more details on staggered equipment and their effect on cycle time, see Specifying Staggered Equipment. The actual recipe cycle time (the actual time between two consecutive batch starts) was set to 36 hours for this example (through the ‘Recipe Scheduling Information’ dialog). The recipe batch time (the time required to complete a single batch) is roughly 160 hours.
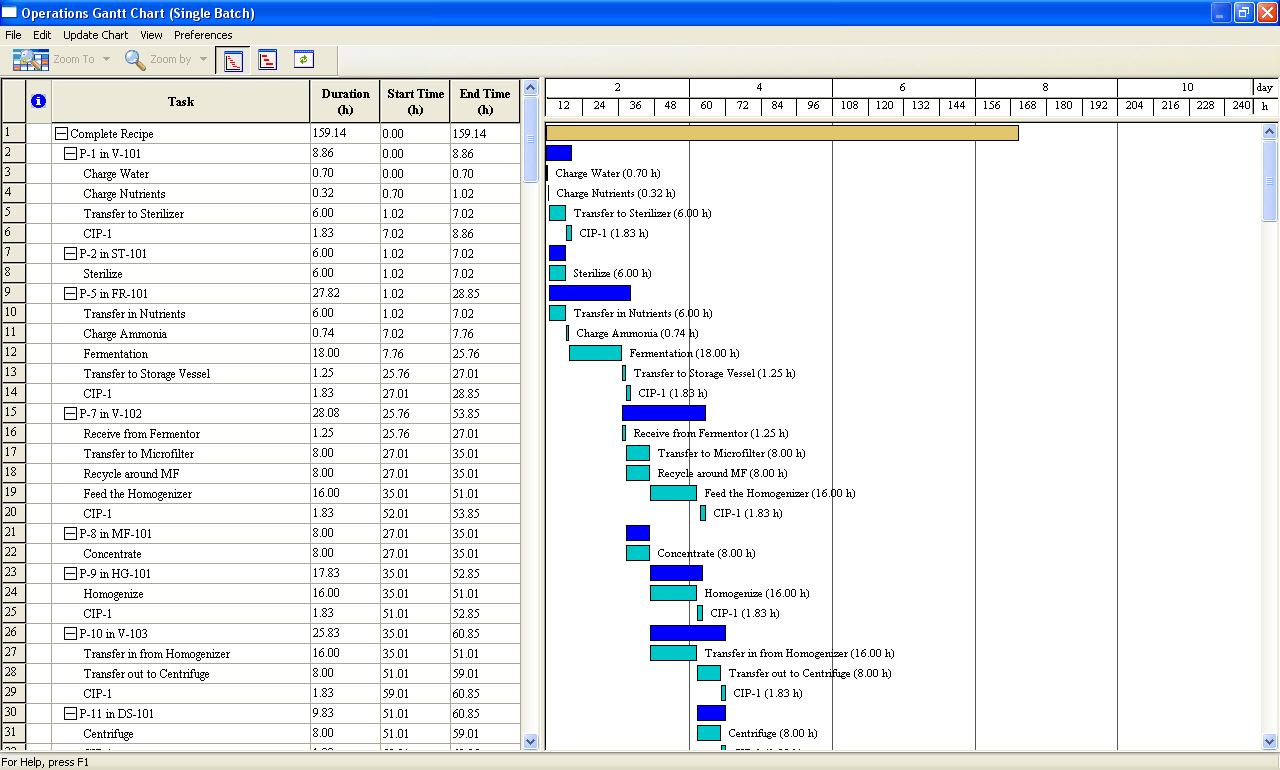
The Operations Gantt Chart for a single batch.
SuperPro Designer also generates charts of resource demand as a function of time for raw materials, heating and cooling utilities, power, and labor. WFI Consumption Chart for 5 consecutive batches. displays the consumption of pure component ‘WFI’ (water for injection) for 5 consecutive batches of this process. To generate this chart, select Materials } Entering } Multiple Batches on the Charts menu. In the ‘Ingredient Consumption Chart’ dialog that appears, select pure component ‘WFI’. Also, make sure that the options to include pure component participation in stock mixtures and discrete entities are not checked. This will ensure that the chart will display solely pure component consumption.
In this chart, the red line represents instantaneous consumption rate, the blue line represents time-averaged consumption rate (over a period of 12 hours) and the green line represents cumulative consumption amount (reset to zero every 12 hours). This information is specified through the ‘Ingredient Consumption Chart Style’ dialog. To open this dialog, right-click on the chart to bring up its context menu and select Edit Style. The chart provides useful information for sizing WFI systems:
● The tallest red peak (highest instantaneous demand) is useful information for sizing the pipe diameter of the circulation loop and its pumping capacity since the loop and the pump must be able to accommodate the highest instantaneous demand.
● The tallest green peak provides useful information for sizing the surge tank of the WFI system. It corresponds to the working volume of the surge tank if a 12-hour buffer capacity is required (i.e., a 12-hour supply even if the still is not operational during that period).
● The tallest blue peak provides useful information for sizing the still. The larger the averaging interval, the greater the size of the surge tank and the smaller the size of the still. In other words, there is a trade-off between still size and tank size in the sizing of WFI systems.
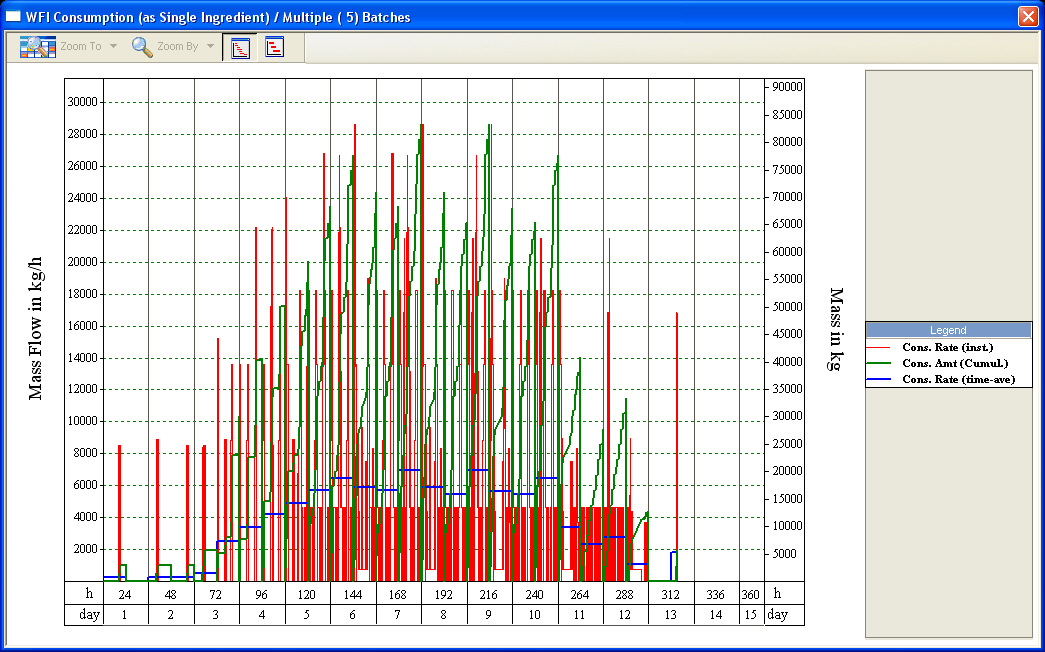
WFI Consumption Chart for 5 consecutive batches.
SuperPro Designer can also analyze and display inventory information for material resources. Suppose that there is a 100,000 kg WFI storage tank whose initial contents are zero. Suppose further that the WFI still has a rate of 20,000 kg/h and it is turned on when the level in the tank drops below 35% and off when it reaches 100%. The graph of WFI inventory profile for five consecutive batches. shows the WFI level in the storage tank (green line) and the operation of the still (pink line) for five consecutive batches. To visualize the liquid level in the tank and the operation of the still, first select Materials } Entering, Inventory } Multiple Batches on the Chart menu. In the ‘Ingredient Inventory Chart’ dialog that appears, select pure component ‘WFI’ and make sure that the options to include pure component participation in stock mixtures and discrete entities are not checked (as was done for the WFI consumption chart). This will ensure that the chart will display solely pure component consumption. Then, click the Supply Info button to bring up the ‘Resource Inventory Data’ dialog for WFI. Specify the size of the tank, the rate of the still, the initial contents and the on/off criteria (the values provided above) and click OK to return to the previous dialog. Then, click OK once more to close the ‘Ingredient Inventory Chart’ dialog and generate the chart.
For more details on the above charts, see Viewing Scheduling, Equipment Utilization and Resource Tracking Results.
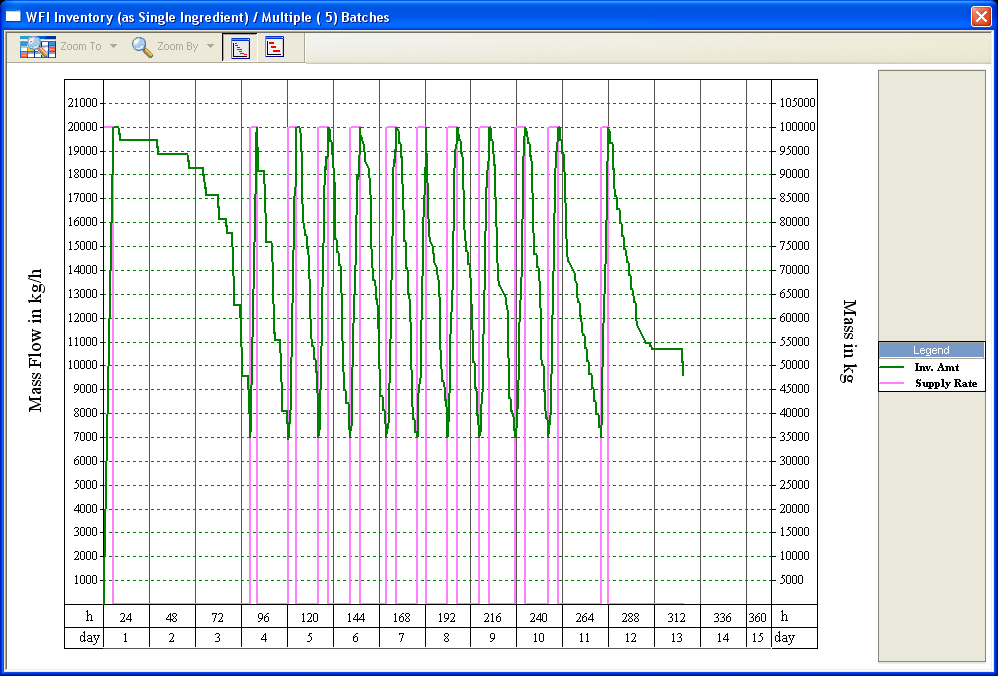
WFI inventory profile for five consecutive batches.
SuperPro Designer is equipped with powerful throughput analysis and debottlenecking capabilities. These include the Utilization Factors chart and the Batch Size Potential chart.
Please generate the Utilization Factors chart for this example now. It can be seen that procedure ‘P-15’ that utilizes chromatography column ‘C-101’ has the highest combined equipment utilization. Therefore, that procedure/equipment combination is indicated on the chart as the size bottleneck in terms of combined utilization.
Next, please generate the Batch Size Potential chart for this example, using the flow of component ‘B-Gal’ in the ‘Product’ stream as reference. For this example, the procedure/equipment combinations ‘P-18/C-102’, ‘P-7/V-102’ and ‘P-15/C-101’ are based on conservative, realistic, and theoretical, estimates of batch size potential, respectively.
For more details on these charts, see Throughput Analysis and Debottlenecking.
SuperPro Designer performs thorough cost analysis and economic evaluation calculations and generates three pertinent reports. These are:
● the Economic Evaluation Report (EER),
● the Itemized Cost Report (ICR), and
● the Cash Flow Analysis Report (CFR).
Below are the key results of cost analysis for a plant producing approximately 18,350 kg of b-Gal per year. The table shown in The executive summary table of the Economic Evaluation Report (EER). provides an overview of the total economic impact of the plant, including the total capital investment, annual revenues, and rate of return. This table was extracted from the PDF version of the Economic Evaluation Report (EER). To generate the EER, click Economic Evaluation Report (EER) on the Reports menu.
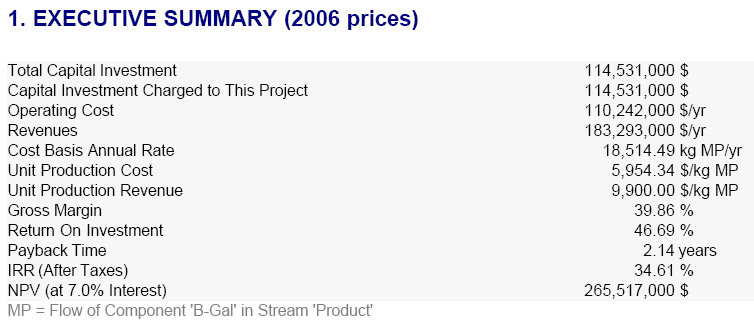
The executive summary table of the Economic Evaluation Report (EER).
The tables in The operating costs summary table per cost item of the Itemized Cost Report (ICR). and The operating costs summary table per section of the Itemized Cost Report (ICR). provide cost breakdowns per cost item and per section, respectively, of the total annual operating cost over all process sections for this process. These tables were extracted from the PDF version of the Itemized Cost Report (ICR). To generate the ICR, click Itemized Cost Report (ICR) on the Reports menu. The ICR enables the user to readily identify the cost-sensitive sections of a process – the economic hot-spots. For instance, The operating costs summary table per cost item of the Itemized Cost Report (ICR). reveals that the cost of consumables is the largest cost in this example, accounting for roughly 53% of the total annual operating cost over all sections. This cost accounts for the expensive chromatography resins that need to be replaced periodically.
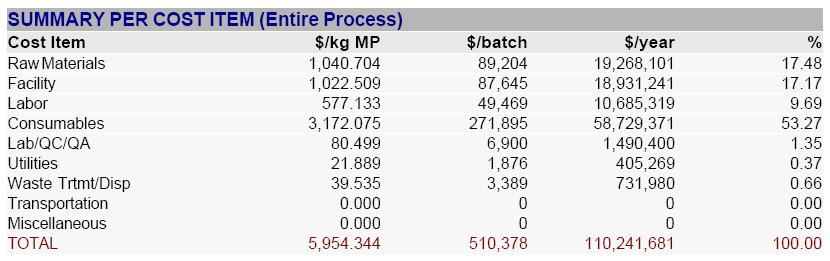
The operating costs summary table per cost item of the Itemized Cost Report (ICR).
Furthermore, the table in The operating costs summary table per section of the Itemized Cost Report (ICR). reveals that the ‘Purification’ section is the most expensive part of this process. Thus, it would be wise to allocate resources to optimize this section, as opposed to using those same resources elsewhere where optimization would have little effect on the overall project cost.
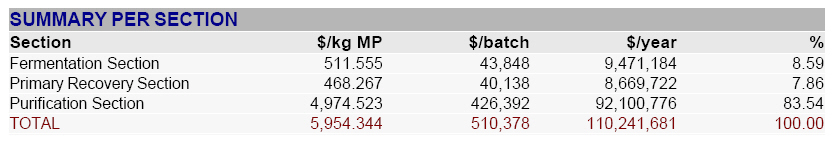
The operating costs summary table per section of the Itemized Cost Report (ICR).
The above analysis shows how the economic reports can be used as a tool to optimize a process through ‘what-if’ scenarios by examining individual cost items:
● Would it make economic sense to use a less expensive chromatography resin if it required more cycles to be run and more buffer solution to be used? It depends on how many more cycles are needed, and how much cheaper the new resin is.
● Would a radically modified purification scheme be better than the current scheme? It depends on what equipment, reagents, etc. would be required for the modified scheme, and and what would be the impact on the overall product yield.
This type of what-if analysis is quickly and easily done using SuperPro Designer.
In addition, the CFR can be generated for this example by selecting Cash Flow Analysis (CFR) on the Reports menu. For more details on cost analysis and economic evaluation, see Cost Analysis and Economic Evaluation.
You may also want to generate the Emissions Report (EMS) and the Environmental Impact Report (EIR) for this process. To do that, select Emissions (EMS) or Environmental Impact (EIR) on the Reports menu; for more details, see Environmental Impact.
SuperPro Designer contains a variety of formulation, packaging, and transportation unit procedures in order to capture the cost associated with such processes (see procedures ‘P-21’ to ‘P-23’ in file ‘Bgal8_0c’, for example).
Most material flows in SuperPro Designer are bulk material flows. Product formulation and packaging processes often involve formation and use of discrete entities, such as tablets, bottles, boxes, etc. The flow of such entities is represented by discrete streams, which are displayed by default in blue. Discrete procedures may be placed on the flowsheet and connected like any other procedure. Connection points for discrete streams are indicated by an open connection point, as shown in Stream connection points for bulk materials and discrete entities. below.
To familiarize yourself with the formulation and packaging models and the concepts of discrete streams and entities, please open the ‘Bgal8_0c’ file that can be found in the ‘Examples\BGal’ directory of SuperPro Designer. Visit the simulation data dialogs of the various packaging unit procedures (‘P-21’ to ‘P-23’) and their corresponding operations and streams. Notice the different simulation data interface of discrete streams, which displays the flow of discrete entities as well as the equivalent bulk flow (based on the bulk ingredients that compose the discrete entities). A discrete operation in these unit procedures may convert a bulk material stream into a discrete entity stream (e.g. bulk liquid product to filled bottles) or a discrete entity stream to another (e.g. unlabeled bottles to labeled bottles).
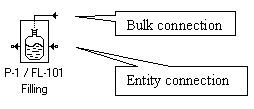
Stream connection points for bulk materials and discrete entities.
Another good example for dosage formulation and discrete processing can be found in the ‘Examples\PhTablet’ directory of SuperPro Designer. That example deals with a process that manufactures pharmaceutical tablets. For more information on discrete streams and entities, see Chapter 4 (Streams) or consult the Help documentation.