eq. (A.200)
The purpose of this unit operation model is to simulate the performance of a clarification basin for removing activated sludge as well as other particulate components.
The material balances are based on the removal % of the particulate components and the particulate concentration in sludge (in mg/liter). The removal percentage of particulate components is either specified by the user or calculated by the program using a simple empirical model described by the following equation (Ibrahim and Atasi, 1989):
|
|
eq. (A.200) |
where R is the removal percent of suspended solids, Cin is the influent suspended solids concentration, OR is the overflow rate, and a, n, and m are empirical constants. When the empirical model is used, the user is supposed to identify the particulate components that are removed. Please note that the same removal percentage (calculated by the above equation) is applied to all removable components. If this is not an acceptable assumption, then, you may specify the removal percentage of all particulate components by selecting the ‘Set By User’ option. The particulate concentration in sludge determines the amount of liquid and soluble components that remain in the sludge stream.
In Design Mode of calculation, the user either specifies the overflow rate in m3/m2-day or provides the properties (particle diameter and density) of a limiting particle component. If the overflow rate is specified, then, the sedimentation area (cross sectional area of the basin) is calculated by simply dividing the flowrate of the clarified water by the overflow rate. If the calculated cross sectional area exceeds the maximum, the program assumes multiple units operating in parallel with a total cross sectional area equal to the calculated.
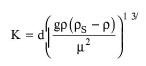
If the properties of a limiting particle component are provided, its sedimentation velocity, Vc, is estimated using a modified version of the Stokes' law (Smith and Harriott, 1993). More specifically, the K term is calculated first.
|
|
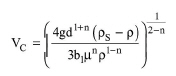
Depending on the value of K, different values are assigned to the bl and n parameters according to the table below.
|
K |
bl |
n |
|
|
||
|
=< 3.3 |
24.0 |
1.0 |
|
> 3.3 and =< 43.6 |
18.5 |
0.6 |
|
> 43.6 |
0.44 |
0.0 |
Then, the sedimentation velocity is calculated using the following equation.
|
|
where:
● g is the gravitational constant,
● ρs is the density of the particle,
● ρ is the density of liquid,
● d is the diameter of the design particle, and
● μ is the viscosity of fluid.
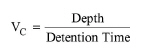
Then, the cross sectional area of the clarification basin, A, is calculated by simply dividing the flowrate of the clarified water, Q, by the sedimentation velocity of the design component.
|
|
eq. (A.203) |
For continuous-flow sedimentation, the depth of the basin and the time a unit volume of water is in the basin (detention time) should be such that all particles with the design velocity Vc will settle to the bottom of the tank. The design velocity, detention time, and basin depth are related as follows:
|
|
eq. (A.204) |
In Rating Mode of calculation, the user specifies the number and size of basins and the program calculates the overflow rate.
This operation may result in VOC Emissions if volatile compounds are present in the feed stream.
1. Hwang, S. T. 1982. “Toxic Emissions from Land Disposal Facilities,” Environmental Progress. 1: 46-52.
2. Smith J.C. and Harriott, P. (1993). “Unit Operations of Chemical Engineering”, 5th Edition, McGraw-Hill.
3. Tchobanoglous G. and F.L. Burton (1991). “Wastewater Engineering: Treatment, Disposal, and Reuse”, Third edition, Metcalf & Eddy, Inc., McGraw-Hill, Sec. 6-3.
4. Ibrahim A.A. and Atasi K.Z. (1989). “Computerized Operating Program for Plant Operation: COPPO”, Detroit Water & Sewerage Department, Applied Technology & Evaluation Section, 9300 W. Jefferson, Detroit, MI 48209, presented at the 62nd Annual Conference of Water Pollution Control Federation in San Francisco, CA, Oct. 15-19, 1989.
The interface of this operation has the following tabs:
● Oper. Cond’s, see Clarification: Oper. Conds Tab
● Vent/Emissions, see Cont. Stoich. Reaction in a Photobioreactor: Vent/Emissions Tab
● Labor, etc, see Operations Dialog: Labor etc. Tab
● Description, see Operations Dialog: Description Tab
● Batch Sheet, see Operations Dialog: Batch Sheet Tab
● Scheduling, see Operations Dialog: Scheduling Tab