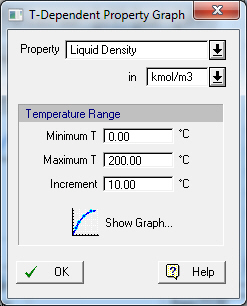
This dialog appears when you click on the Plot Any T-Dependent Property button from the Pure Component Properties Dialog: Physical (T-Dependent) tab or the DIPPR Pure Component Properties Dialog: Physical (T-dependent) tab.
From this interface you may plot a line that displays the dependency of various properties of a pure component on the temperature. Th properties that can be graphed are the liquid and solid densities, the liquid, solid and ideal gas heat capacities, the vapor pressure and the heat of vaporization.
The user can select the temperature range and increment in degrees Celsius (oC). Once you have selected the property you wish to plot and the temperature range, just click on the Show Graph button to show the graph.
See also T-Dependent Property Chart.