This chart is generated by selecting Charts } Throughput Analysis } Utilization Factors from the main menu of the application.
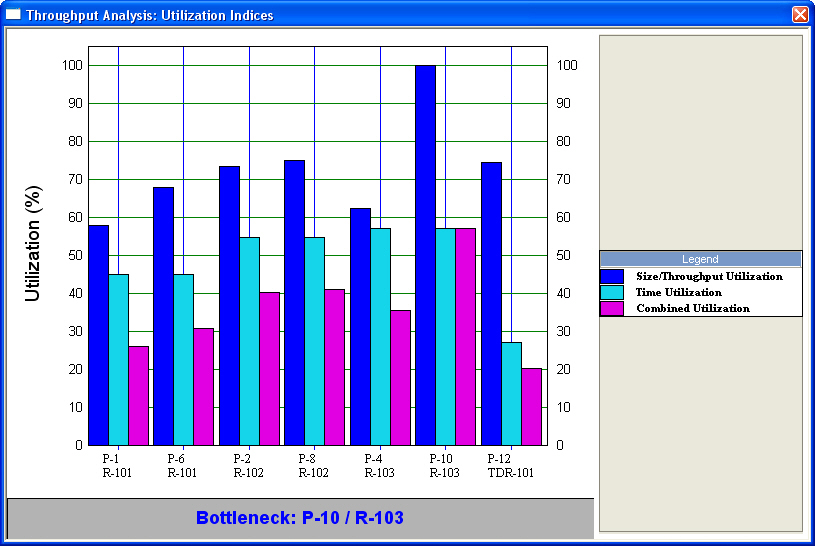
This chart displays the percent equipment capacity, time and combined utilization for each unit procedure/equipment combination in a process. Each entry in the x-axis represents a unit procedure - associated host equipment combination. The name of the unit procedure as well as the equipment that hosts the procedure mark each entry. Each bar represents one of the three different utilization factors:
● Size/Throughput (i.e., equipment capacity) utilization,
● Time (i.e., equipment uptime) utilization, and
● Combined utilization.
The procedure/equipment combination that has the highest combined utilization factor is defined as the bottleneck and it is mentioned at the bottom of the chart; for more details on these factors, see Identifying Equipment Size and Throughput Bottlenecks.
As in all other charts, you can change the appearance and contents of the chart by right-clicking on the chart and selecting Edit Style on the context menu that appears. This will bring up the Style for Throughput Utilization Chart Dialog. For instance, the chart shows by default the procedure-equipment combinations involving equipment in Rating mode only. However, you can choose to allow (if so desired) to display equipment in Design mode as well. This may be a preferred choice in case of equipment resources that are shared by several procedures in order to view how each procedure is utilizing the equipment, and to pinpoint the procedure that is actually responsible for the sizing of the equipment (‘heaviest’ user).
Also, by default, when the chart first comes up it is in the ‘Fit-to-Window’ mode (the Fit to Window option on the chart’s right-click menu is checked and the Fit Chart to Window button is pressed). That is, SuperPro Designer will attempt to show all entries in the x-axis in the available space. If you are dealing with a process file that has many procedures and the outcome is not pleasing, you may switch to the ‘Show-at-Nominal-Size’ mode by either unchecking the Fit to Window option on the chart’s right-click menu, or clicking on the Show Chart at Nominal Size button. Remember that in this case you may have to scroll to the right in order to see the bars for all procedures in the current process file.
See also:
● Definitions & Theory of Throughput Analysis
● Equipment Data Dialog: Throughput Tab