eq. (11.1)
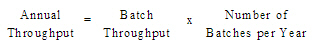
The batch throughput (or batch size) of a batch manufacturing facility corresponds to the amount of material that is processed per batch. The annual (or campaign) throughput of a batch manufacturing facility corresponds to the amount of material that is processed per year. It is calculated as the batch throughput times the number of batches that can be processed per year:
|
|
eq. (11.1) |
Therefore, we can increase the annual throughput by either increasing the batch throughput, or the number of batches per year, or both. In our effort to increase annual throughput we run into bottlenecks that are either related to equipment or resources (e.g., utilities, labor, demand for raw materials).
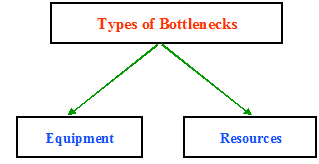
Type of Bottlenecks.
The equipment or resource that limits the number of batches per year is the scheduling (or time) bottleneck. The equipment or resource that limits the batch throughput is the batch size bottleneck. The equipment or resource that limits the annual throughput is the throughput bottleneck. Either the time or the batch size bottleneck is also the throughput bottleneck.
Please note that for a batch process the batch size and the number of batches per year are interdependent. More specifically, as the batch throughput is increased (operating closer to the maximum), the cycle time of most procedures will increase resulting in longer recipe cycle times and fewer batches per year. Consequently, the maximum annual plant throughput cannot be simply set equal to the maximum batch size times the maximum number of batches per year. Instead, it can be calculated in an iterative way by gradually increasing the batch size and letting SuperPro Designer calculate the corresponding maximum number of batches.
Information on the equipment scheduling bottleneck is provided on the Recipe Scheduling Information Dialog (see Chapter 7 (Scheduling)). The same information can be visualized graphically on the Equipment Occupancy Chart (see Equipment Occupancy Chart). The scheduling (or time) equipment bottleneck is the piece of equipment that has the longest cycle time. This piece of equipment determines the minimum time between consecutive batches (also known as minimum recipe cycle time) and consequently the maximum number of batches per year. For main equipment items that are shared by multiple procedures, their cycle time is set equal to the time interval between the start of the first procedure that is hosted by the equipment to the end of the last procedure that is hosted by the same equipment. Please note that resources also can become time bottlenecks (see Resource Bottlenecks).
The batch size bottleneck can be identified by considering the capacity and time utilization of each equipment item.
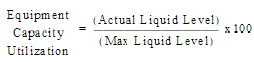
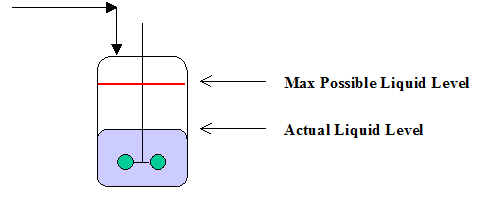
The equipment capacity (or batch size/throughput) utilization represents the percentage of equipment capacity that is utilized during a certain unit procedure. For instance, if a piece of equipment that can process up to 100 kg/h of a certain material is operated at a rate of 80 kg/h, its equipment capacity utilization will be 80%. If a piece of equipment is of vessel type, its capacity utilization can be defined based on the ratio of actual and maximum liquid levels for a certain operation:
|
|
eq. (11.2) |
Capacity Utilization illustrates this in detail. The equipment capacity utilization of a unit procedure corresponds to the maximum equipment capacity utilization among all operations of that unit procedure. The cyclical equipment with storage capacity that has the highest capacity utilization determines the maximum batch size and is therefore the batch size bottleneck.
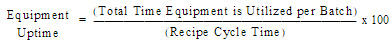
The equipment uptime represents the percent of overall operating time that a certain piece of equipment is occupied. For batch processes, the equipment uptime can be defined as follows:
|
|
eq. (11.3) |
The recipe cycle time is the time interval between consecutive batches. If a piece of equipment is used by multiple procedures (in a batch plant), the equipment uptime accounts for the overall (of all procedures) utilization in time.
Many procedures have uptimes (as well as cycle times) that are proportional to the amount of material processed per cycle. For example, if you have a disk-stack centrifuge that processes material in a continuous fashion without accumulating anything and double the batch volume, the uptime of the centrifuge will also double. Equipment items of this type usually operate at 100% capacity utilization and changes in batch size only affect their uptime. This is an important point to understand; just because a piece of equipment is listed as having 100% capacity utilization, it not necessarily the throughput bottleneck. For this reason, a combined utilization is also calculated as described below.
The combined utilization of a unit procedure is calculated as its equipment capacity utilization times its equipment uptime. To have a combined utilization of 100%, the procedure's equipment would have to be run at full capacity and its cycle time would have to be the same as the recipe cycle time. The procedure with the highest combined utilization is identified as the throughput bottleneck for a process in the Throughput Analysis: Utilization Factors Chart. An example of this chart is shown in Throughput Analysis: Utilization Factors chart.. This chart displays the percent equipment capacity, time and combined utilization for each unit procedure-equipment combination in a process. This chart is generated by selecting Charts } Throughput Analysis } Utilization Factors from the main menu of the application. By default, only unit procedures whose equipment is in Rating mode (i.e., the equipment size is user-defined) are included. However, you can choose to allow (if so desired) to display equipment in Design mode as well by visiting the Style for Throughput Utilization Chart Dialog (right-click on the chart and select Edit Style on the context menu that appears).
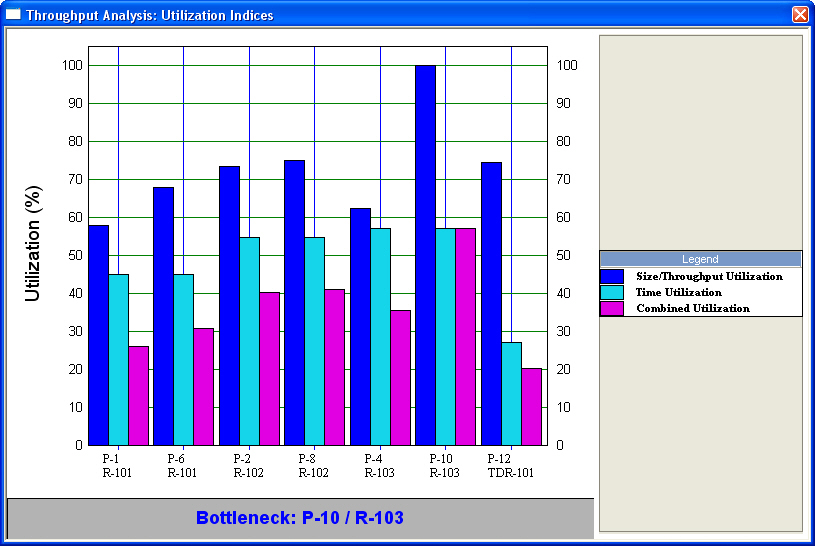
Throughput Analysis: Utilization Factors chart.
For this example, procedure P-10 that utilizes vessel R-103 has the highest combined utilization and is therefore identified as the throughput bottleneck based on this criterion. This methodology points in the right direction regarding bottleneck identification, but it cannot guarantee identification of the right bottleneck when cyclical procedures are included in the process. Cyclical procedures (i.e., procedures that go through cycles of activities, such as batch chromatography steps) impose constraints on time utilization and may lead to situations where the true throughput is a procedure that does not have the highest combined utilization. For instance, if the recipe cycle time of a batch process is 100 hours, and a reaction step in a vessel takes 60 hours, in a regulated environment where batch integrity is maintained (that's the case with the pharmaceutical industry), the reaction vessel can have a practical maximum uptime of 60%. If the specific vessel operates at full size utilization, it will be the throughput bottleneck even if some other equipment has a higher combined utilization.
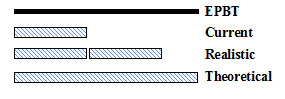
A better way of identifying throughput bottlenecks is by calculating the Potential Maximum Throughput (PMT) of each procedure. For procedures that have cycle times proportional to batch size (e.g., disk-stack centrifugation, pumping, etc.), the PMT is calculated by assuming 100% equipment capacity utilization and 100% uptime. For procedures whose cycle times are not proportional to their throughputs (e.g., vessel procedures, chromatography, etc.), their PMT is calculated under conservative, realistic, and theoretical assumptions for their uptime:
1. In the conservative case, the equipment uptime is kept the same as its current uptime.
2. In the realistic case, the equipment uptime is set to correspond to the highest number of complete cycles that can be performed in that piece of equipment within the time window of the current recipe cycle time.
3. In the theoretical case, the equipment uptime is assumed to be at 100%. This would require mixing of partial lots of product, which typically is not an option in the regulated industries (e.g., pharmaceutical industry).
The equipment capacity utilization is assumed 100% in all the cases. This is illustrated in Potential batch size. below. In this figure, EPBT (Equipment Potential Batch Time) corresponds to 100% equipment uptime.
The objective is to identify the TRUE throughput bottleneck based on the realistic scenario. The conservative scenario corresponds to the case where we operate all the equipment items at 100% capacity utilization but without making any changes in the number of cycles per batch. Throughput Analysis: Potential Throughput chart. shows the Throughput Analysis: Batch Size/Throughput Potential Chart (the PMT
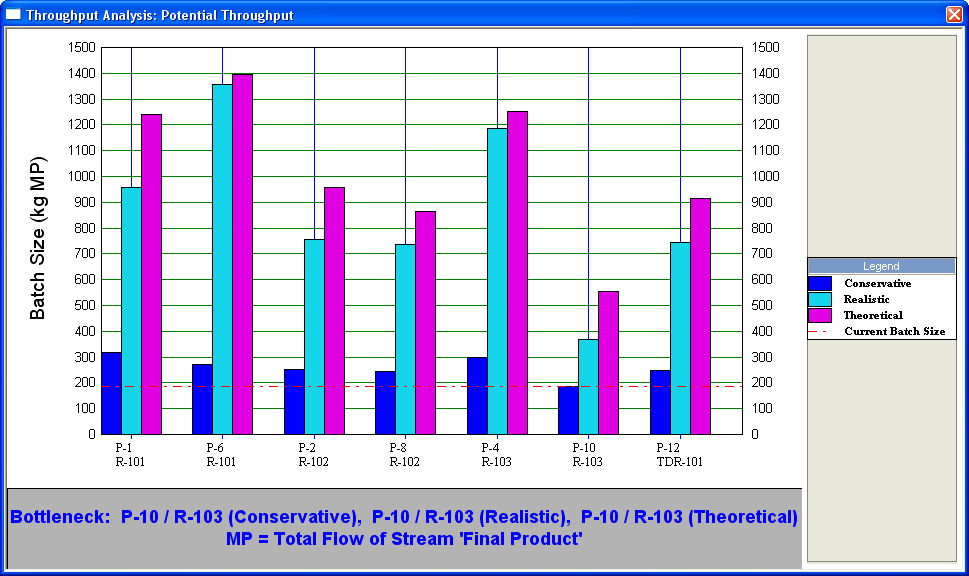
Throughput Analysis: Potential Throughput chart.
chart) for a process. This is the same process for which the Utilization Factors chart was shown previously in Throughput Analysis: Utilization Factors chart.. The PMT chart is generated by selecting Charts } Throughput Analysis } Batch Size Potential from the main menu of the application. For this example, it can be seen that all three indicators identify the unit procedure-equipment combination P-10 / R-103 as the bottleneck based on this approach as well. That’s a good sign that indeed this is the true bottleneck of this process.
|
|
Equipment can be excluded from throughput analysis by visiting the Equipment Data Dialog: Throughput Tab and checking the ‘Omit from Throughput Analysis’ option. Then the equipment will not be displayed in any Throughput Analysis Charts (Utilization, Potential). In particular if an equipment is omitted from scheduling calculations it is also omitted from throughput analysis. |
You can change the appearance of the PMT chart by visiting the Style for Throughput Potential Chart Dialog (right-click on the chart and select Edit Style on the context menu that appears).
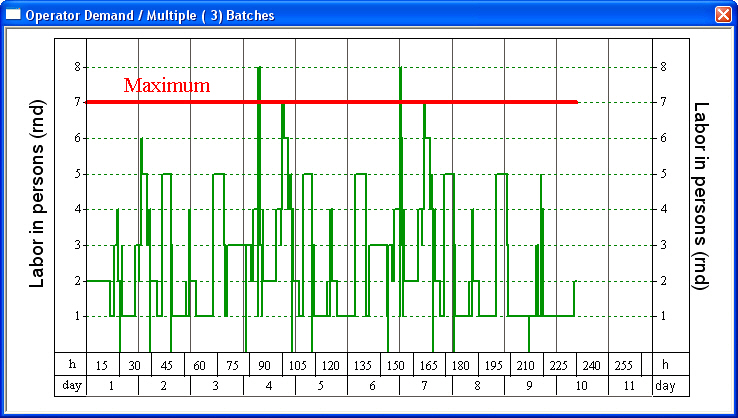
Resources can become size and time bottlenecks when their average or instantaneous demand exceeds their average or instantaneous capacity, respectively. For instance, Resource demand chart. below shows the demand for labor as a function of time for three consecutive batches of a process. For short periods of time, there is a need for up to eight operators. If seven (red line) is the maximum number of operators that can be available at any time, then, certain operations will have to be delayed to accommodate that constraint. That delay of operations may increase the recipe cycle time and reduce the maximum number of batches per year and therefore become the new time bottleneck.
The current version of SuperPro Designer does not identify resource time bottlenecks. However, it calculates and displays the demand for any resource (e.g., raw materials, heating/cooling utilities, power, and labor) and enables the user to visualize and interactively eliminate potential resource bottlenecks. In SchedulePro, however, the user may specify a maximum for each resource and the scheduling algorithm will automatically delay the execution of certain operations in order to meet those constraints.
For more information on resources and resource time charts, see Chapter 6 (Resources).
When a specific piece of equipment becomes the overwhelmingly dominant scheduling bottleneck in a recipe, in other words, when its occupation time (per batch) exceeds by far any other equipment in the recipe, thereby leading to large plant cycle times, it is worthwhile to consider using extra pieces of equipment operating in staggered mode to effectively reduce the plant’s cycle time.
For instance, consider a recipe involving a fermentation procedure that lasts one week (or 168 hours) followed by a downstream processing sequence where the longest procedure doesn’t exceed 48 hours. If you restrict yourself operating with a single fermentor vessel, then you are forced to start a batch once every 168 hours, which is the recipe cycle time in this case. This is depicted in the Equipment Occupancy Chart of Equipment Occupancy Chart of an example recipe involving a long fermentation procedure.. Clearly, the scheduling bottleneck (the equipment with the longest cycle time) in this case is the fermentor vessel FR-101; for more details on this chart, see The Equipment Occupancy Chart (EOC).
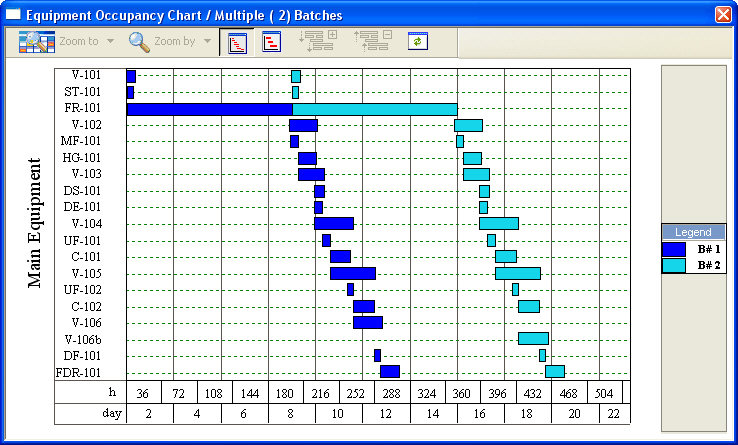
Equipment Occupancy Chart of an example recipe involving a long fermentation procedure.
However, if you could use 6 additional fermentors (of the same or larger size) and operate them in staggered mode, i.e., start them at 48 hours apart, then, you could reduce the recipe’s cycle time to 48 hours, thereby increasing your annual throughput by a factor of 7.
In SuperPro Designer, you can specify extra sets (M) of equipment in staggered mode (i.e., out of phase) for an equipment resource. A set consists of a number of units operated in parallel (i.e., simultaneously). This is either specified (in Rating Mode) or calculated (in Design Mode). Consequently, the actual number of units represented by an equipment resource will be equal to the total sets (M+1) times the number of units (N).
Specifying extra sets of equipment in staggered mode for an equipment resource in SuperPro Designer is very simple. Just bring up the Equipment Data Dialog: Equipment tab of a unit procedure, set the ‘Stagger Mode’ option to ‘On’, and type in the number of extra sets of equipment that you wish to use in association with that unit procedure. For instance, in the example mentioned earlier in this section, you would type ‘6’ as the extra sets in staggered mode and click OK to close the dialog. Then, you should redo the M&E Balance calculations and observe the new value of the recipe’s cycle time.
The Equipment Occupancy chart of the recipe after 6 extra sets of fermentors are specified in staggered mode is shown in Equipment Occupancy Chart of the example recipe after 6 extra sets of fermentors are specified in staggered mode.. Since staggering M extra pieces of equipment in that unit procedure essentially reduces the participation of that unit procedure to the recipe cycle time by a factor equal to M+1, and unless another piece of equipment becomes the scheduling time bottleneck, the recipe cycle time will be reduced by just as much. Of course, if another unit procedure (e.g., a long chromatography step or storage unit) becomes the time bottleneck, then the reduction of the recipe cycle time will be determined by the cycle time of that unit procedure. This is the case for the example presented above, in which the blending tank V-105 is now the scheduling bottleneck (the corresponding unit procedure carried out in that equipment has the longest cycle time).
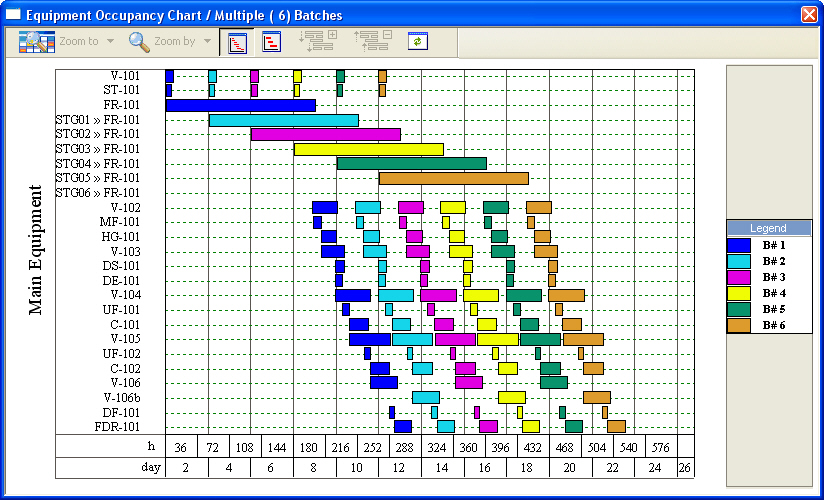
Equipment Occupancy Chart of the example recipe after 6 extra sets of fermentors are specified in staggered mode.
|
|
Even though users do not name the staggered equipment, SuperPro Designer will automatically generate names for them that will be used when presenting the Equipment Occupancy chart. The names of the staggered equipment are created by using as starting root the name of the main equipment (as set by the user on the recipe) and adding in front of that name the string “STG01>>”, “STG02 >>”, etc. to indicate the first, second, etc. additional pieces of equipment utilized in staggered mode (see chart above). |
For more information on equipment sizing, please see Sizing (Design vs Rating Mode). For more information on equipment staggered mode, please see Staggered Mode.