The following table shows a brief description of the variables appearing in this tab. The table also displays their default values and their generally acceptable range:
|
Variable |
Default Value |
Range |
|
|
||
|
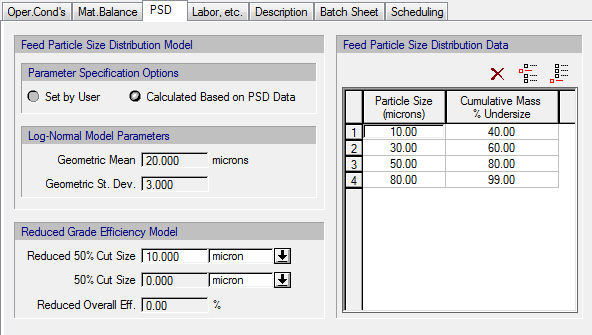
◙ Geometric Mean (of Feed PSD) (microns) |
20.0 |
Positive |
|
◙ Geometric St. Dev. (of Feed PSD) |
3.0 |
Positive |
|
○ Particle Size (microns) |
0.0 |
Positive |
|
○ Cumulative Mass % Undersize (%) |
0.0 |
0 – 100 |
|
◙ Reduced 50% Cut Size (micron) |
10.0 |
Positive |
|
● 50% Cut Size (micron) |
0.0 |
Positive |
|
● Reduced Overall Eff. (%) |
0.0 |
Positive |
Symbol Key: ○ User-specified value (always input); ● Calculated value (always output); ◙ Sometimes input, sometimes output
The following list describes the available specification choices in this tab; for more details on how these are implemented, see Centrifugation in a Hydrocyclone: Modeling Calculations.
•Parameter Specification Options for the Particle Size Distribution Model...
If you select the “Set by User’ option, then you must specify the parameters of a lognormal feed particle size distribution model (geometric mean and standard deviation).
If you select the option “Calculated Based on PSD Data” then you must specify a set of particle size - cumulative mass % undersize data for the feed. The program will fit a lognormal particle size distribution to those data.
•Particle size distribution data points...
The particle size and cumulative mass % undersize must be in ascending order. Each row of the Particle Size Distribution Data table corresponds to a data point. To add a new row to the end of the table, click Add ( ) on the toolbar. To insert a new row above an existing one, select that row by clicking on the corresponding row number and then click Insert (
 ) on the toolbar. To delete a row, select that row by clicking on the corresponding row number and then click Delete (
 ) on the toolbar.