The Binary Chart Dialog
By clicking on the “Plot Binary VLE Charts” button  , you have the option to create a binary VLE chart of any two components registered in the process file. In the dialog that appears, specify the components A and B and then select one of the available chart types from the drop-down list. The following chart type options are available:
● Dew xy at T: Dew point composition of the binary mixture at a given temperature. By hovering the mouse over the red curve, the dew point pressures are displayed as tooltips.
● Dew xy at P: Dew point composition of the binary mixture at a given pressure. By hovering the mouse over the red curve, the dew point temperatures are displayed as tooltips.
● Bubble xy at T: Bubble point composition of the binary mixture at a given temperature. By hovering the mouse over blue the curve, the bubble point pressures are displayed as tooltips.
● Bubble xy at P: Bubble point composition of the binary mixture at a given pressure. By hovering the mouse over blue the curve, the bubble point temperatures are displayed as tooltips.
● Pxy at T: Pressure P vs. the mole fractions x (blue curve) and y (red curve) of one of the components at a selected temperature T.
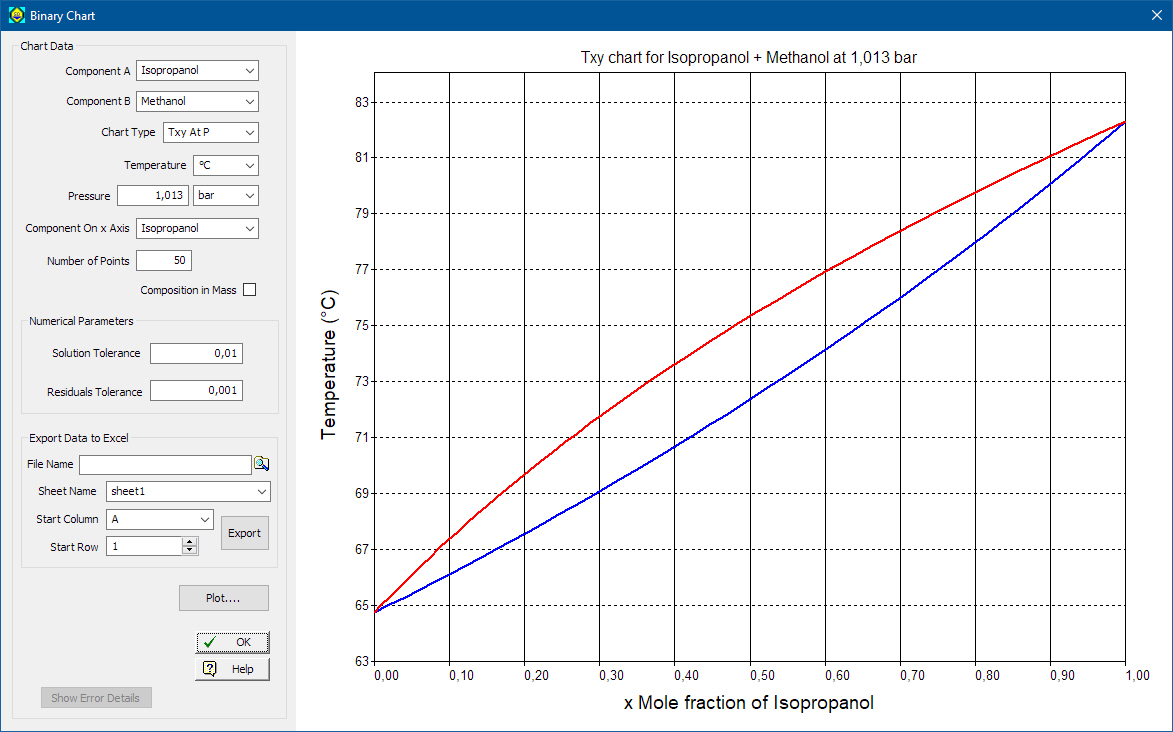
● Txy at P: Temperature T vs. the mole fractions x (blue curve) and y (red curve) of one of the components at a selected pressure P.
Specification Choices / Comments
Other options that can be specified in this dialog are:
● which component will be graphed on the x axis
● the number of points that will be used for the creation of the chart (default value is 50 points)
● and whether you want to show the composition in mass instead of mole
The Calculation numeric settings that can be specified are:
● Solution tolerance (default value: 10-2)
● Residuals tolerance (default value: 10-3)
Finally you may export the plotted data from this chart to Excel, so you may compare it with other data obtained possibly from experiments or other calculation methods. In order to do that you must select an ‘.xls’ file (by clicking on the Explore ( ) button) and choosing the worksheet and start column and row were you want the data to be written. Then just click on the Export button to export the data to Excel.
|

|
The options of the Binary Charts dialog are not saved along with the process file and any modifications will be kept until the process file is closed. Every time you open a process file, the dialog is be initiated with the default options.
|
Click on the button to view the Binary Chart Error Messages Dialog which displays all echoed errors during the VLE calculations of the binary composition.