This dialog appears when you select Charts } Heat Transfer Agents } Consumption } Single Batch or Charts } Heat Transfer Agents } Consumption } Multiple Batches or Charts } Heat Transfer Agents } Consumption } Selected Time Horizon or Charts } Heat Transfer Agents } Inventory } Single Batch or Charts } Heat Transfer agents } Inventory } Multiple Batches or Charts } Heat Transfer Agents } Inventory } Selected Time Horizon from the main menu of the application.
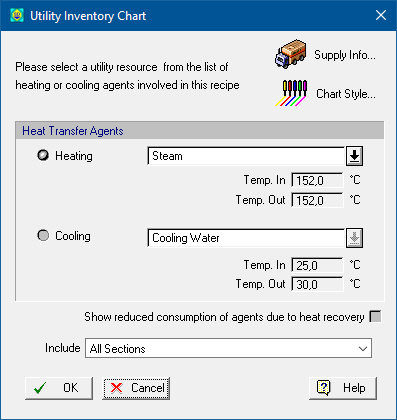
Before you view the chart, you will be presented with a dialog from where you must select whether you want to chart a heating or a cooling agent. And then from the corresponding drop down list you select the heat transfer agent whose consumption you wish to track.
The user may also choose to show reduced consumptions of heat transfer agents if any heat is recovered in the process by checking the “Show reduced consumption of agents due to heat recovery” option. For more details on recovering energy see Energy Recovery.
Include Sections: From this drop down the user can select to view the resource demand or output of resources for specific sections in the process. The drop-down box displays ‘All Sections’ if all sections are selected, or a comma separated string of the selected section names.
From this dialog you may also edit the styles of the chart beforehand by clicking on the View/Edit Chart Styles button ( ), and bringing up the Utility Chart Style Dialog. Clicking on the OK button will produce the chart.