This tab is part of the dialog that presents the graph style characteristics for all material charts; actual elements of the tab may be slightly different depending on whether the chart is a material entering or exiting the process, and whether or not the chart includes accounting for inventory.
•Display Units
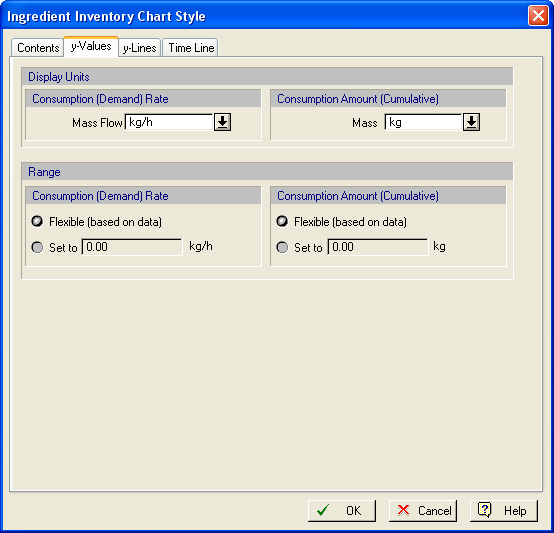
From this box, you specify the units to be used for the y-values shown. Note that the unit selection is associated with the specific material that you are charting (and not the chart itself). This allows you to request to see the amount of consumption in resource-X in kg but the consumption amounts of resource-Y in MT (and the settings will be set only once for resource-X and once for resource-Y).
•Range Specification
By default the application will set the range on the y-axis of the chart such that all values included in the chart show comfortably. Therefore, the range will always be adjusted (based on the data that are being plotted). If you wish to set your own range (so that it is fixed from chart to chart of a given material0 then you can pick the ‘Set to’ option and specify a value to be used for the rate range of values and another to be used for the amount range of values. Please note that this specification is also kept in association with the material shown, so that you can provide distinct ranges for two different materials tracked (as their range of values can be very different).