This tab is part of the dialog that presents the graph style characteristics for all material charts; actual elements of the tab may be slightly different depending on whether the chart is a material entering or material exiting the process, and whether or not the chart includes accounting for inventory.
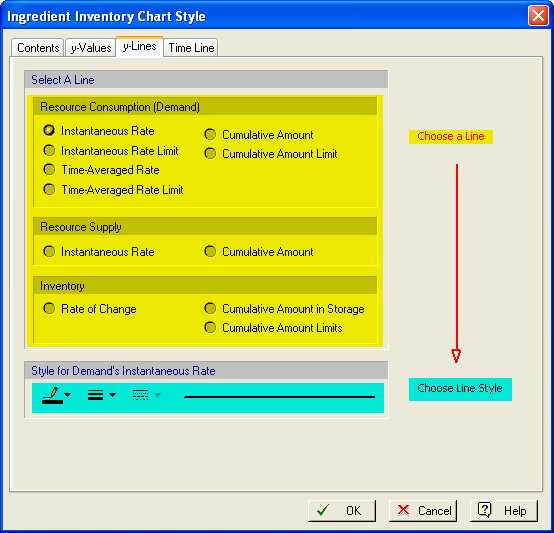
Since there can by up to 11 different lines displayed on a material chart, this tab allows you to set the style of each of the lines that may be displayed on the chart. The way the you make your choices is by first selecting a line that you wish to set the style for, and then chose the line characteristics that you wish this line to bear when shown on the chart. For example, to specify that you want to see the ‘Instantaneous Rate’ line in thick solid red, first select ‘Instantaneous Rate’ in the ‘Select a Line’ box and then pick a red color and a solid-thick option from the controls shown in the ‘Style for Demand’s Instantaneous Rate’ box.
Note that choices made on this tab are applied to all material charts (i.e. they are not associated with the specific material being shown at that time).