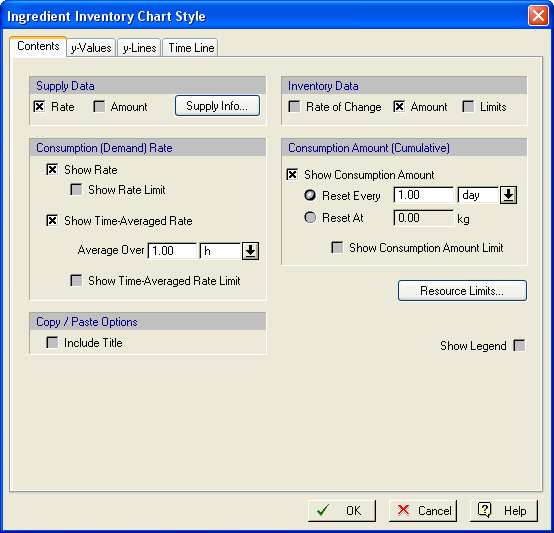
This tab is part of the dialog that presents the graph style characteristics for all material charts; actual elements of the tab may be slightly different depending on whether the chart is a material entering or exiting the process, and whether or not the chart includes accounting for inventory.
•Supply Data (showing only on inventory charts)
If you check the box next to ‘Rate’ then the supply rate for the material will be shown on the graph. If you check ‘Amount’ then the total amount supplied will also be traced. Rates of supply may be on or off (at constant value) for either pre-specified time intervals or according to an on/off strategy specified as part of the inventory description. You can change the rate of supply and the inventory strategy by clicking on the Supply Info button.
•Inventory Data (showing only on inventory charts)
The chart can show the “Rat of Change” for the inventory (that would be the net rate of supply minus consumption) as a function of time. Most commonly users would want to see the “Amount” line. This line shows how much material is present in storage at any time. This amount typically needs to stay within some high and low value (specified also as part of the inventory description). If you check the “Limits” box, then the upper and lower limits set at the inventory description will also be shown on the chart. To change those limits, visit the inventory description dialog by clicking on “Supply Info”.
•Consumption (Demand) Rate
If you check the “Show Rate” box then the actual rate of consumption line will be shown. The rate is the collected from all consuming points and for the consumption origins specified in the material selection dialog. If a rate limit has been specified, then it can also be drawn on the plot by checking the “Show Rate Limit” box. The rate limit for a material resource can be set from the resource’s editing dialog, see Entering or Exiting Material Properties Dialog or from the dialog that appears after clicking on the Resource Limits button.
If you check the “Show Time-Averaged Rate” box, then the actual rate data will be processed and averaged over a time interval specified here and the average rate will be shown across that time window. Please note that time-average values may be a better way to see how material is consumed over a long period but they may miss capturing spikes of consumption that could be bottlenecks in your resource distribution system. Finally, if limits for such averages are provided, then can be shown as well by checking the “Show Time-Averaged Rate Limit” box. As a reminder, those limits may be set as part of the resource description dialog , see List of Entering Materials (& View of Total Consumption Demand) and List of Exiting Materials (& View of Total Output) and also locally by clicking on the Resource Limits button.
•Consumption (Demand) Amount - Cumulative Amount
If you check the “Show Consumption Amount” box then the cumulative demand line (in total amount of material consumed) will be shown. Since this line is an ever-increasing total, it is often practical to see the line with an imposed reset-strategy. The reset strategy (that zeroes the total amount) can be imposed on a time-set period (e.g. every 24 hours) or every time the total reaches a set value. Such strategy may reflect actual policies on the process (esp. when it applies to material exiting the process). A consumption amount limit may also be set (and shown on the chart) if the “Show Consumption Amount Limit” box is checked. As a reminder, those limits may be set as part of the resource description dialog , see List of Entering Materials (& View of Total Consumption Demand) and List of Exiting Materials (& View of Total Output) and also locally by clicking on the Resource Limits button.
•Show Legend
If you check the “Show Legend” box then a small legend window will be shown next to the material chart with a reminder on which value is represented by which line.