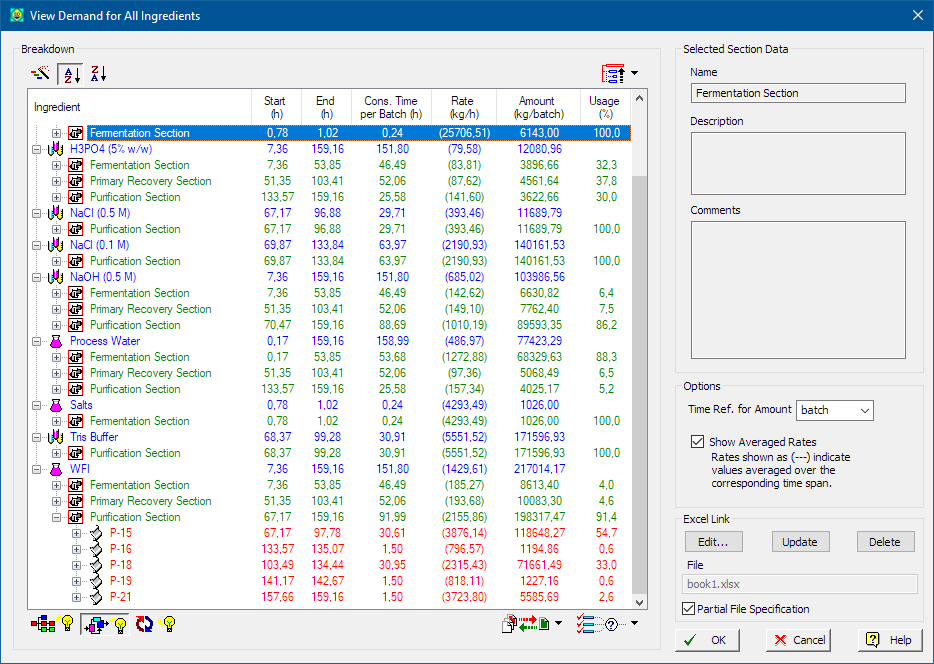
This dialog appears when you select View } Resource Demand Breakdown } Materials from the main menu of the application. It presents the demand for all entering materials and for each material (a node in the tree) it shows how the demand accumulates (aggregates) from the original source points to procedures, sections, branches and of course, all the way up to the total demand for the material itself.
The material demand aggregates (into nodes) as follows:
1. Operations (lowest node)
2. Cycles
3. Procedures
4. Sections
5. Branches
6. Material (top node)
The toolbar at the bottom left of the table allows you to show/hide some of the intermediate levels (cycles, sections, branches). You can include in the table only pure components or only stock mixtures or both. Furthermore, you can dictate which of the five possible classifications of material consumption to be included in the totals. These choices can be made by the controls at the bottom right of the table. If you want to quickly collapse the tree to a certain level, use the control at the top-right of the table. The order of appearance of the top nodes (ingredients) can be set by the controls at the top-right of the table. When selecting a node in the tree the controls on the right-hand side display further information about the node (full name, description, comments - if available-)
•Customization of Contents
The following controls allow you to customize the contents of the table:.
|
|
Order of Appearance Use this drop-down button to include in the viewed list of entering materials pure components only, stock mixtures only, or both stock mixtures and pure components. |
|
|
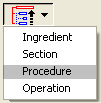
Quick Expand/Collapse Use this drop-down button to quickly collapse the demand tree to the selected level of choice (Ingredient, Section, Branch, Procedure, Cycle or Operation). Some levels may not appear if they have been excluded from the aggregation process (see below). |
|
|
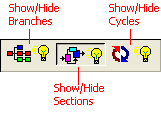
Show / Hide Aggregate Levels Depending on the buttons pressed on this toolbar, the corresponding aggregate levels may or may not show. Typically, you want to include the section level and hide the branch and cycle level (defaults). |
|
|
Include/Exclude Ingredient Types From this drop-down button you select to include in the viewed list of entering materials pure components only, stock mixtures only, or both stock mixtures and pure components. |
|
|
Include/Exclude Consumption Origins The second drop-down button allows you to choose which consumption origins to include when viewing the demand totals in the table above. You may check in or out any of the five possible consumption origins: raw material, cleaning agent, heat transfer agent, on revenue streams and on un-classified streams. |
•Options: Time Ref. for Amount
You may elect to view the demand on a per-batch, per-campaign or per-year basis.
•Options: Show Average Rates
The table shows not only the total amount for a material but also the rate of demand (consumption). For a node representing the source of demand for the material the rate is accurate (exact). When aggregating amounts over to higher levels (e.g. procedure or section), then the application can show an ‘average’ rate that is calculated by totaling the demand and dividing by the span of time between the earlier start of use and latest end of use in that level. If the “Show Average Rates” check box is set, then those rates will be show in parenthesis (to remind you that they are not exact rates but calculated)
|
|
Even though some of the sources for material consumption could be found on the flowsheet on input streams (most commonly the ‘Raw Material’ input streams), the locations as reported on the bottom nodes of the demand breakdown tree-view as shown here are always referring the operation that utilizes that stream (and not the stream itself). |
The demand breakdown tree can be linked and exported to an excel file. The user must select the excel file by clicking on the Edit button. The Link Table to MS Excel Lite Dialog will appear where a MS Excel file and the specific destination (worksheet, cell or range) can be selected. Once an excel file is linked to the demand breakdown tree, the user can click on the Update button to transfer all information on the tree to excel. Clicking on Delete will remove the link with the excel file. Once a link exists any time the mass & energy balance calculations are performed the program will update the linked excel file with the new data.