The following table shows a brief description of the variables appearing in this tab. The table also displays their default values and their generally acceptable range:
|
Variable |
Default Value |
Range |
|
|
||
|
○ Number of points |
10 |
Positive |
|
○ x-Variable |
Time |
Time or % Progress |
|
○ Temperature |
No |
Yes/No |
|
○ Liquid Volume |
No |
Yes/No |
|
○ Vaporization Rate |
No |
Yes/No |
|
○ Component in Contents |
No |
Yes/No |
|
○ Component in Vent |
No |
Yes/No |
|
○ Column Width (spaces) |
12 |
Positive |
|
○ Number of decimals |
4 |
Positive |
|
○ Space Between Columns (spaces) |
3 |
Positive |
|
○ x-Variable Label |
Time |
Any Text |
|
○ Contents Composition Label |
Liquid Mole Fraction |
Any Text |
|
○ Vent Composition Label |
Mole Fraction |
Any Text |
|
○ Temperature Label |
Temperature |
Any Text |
|
○ Volume Label |
Volume |
Any Text |
|
○ Vaporization Rate Label |
Vaporization Rate |
Any Text |
Symbol Key: ○ User-specified value (always input); ● Calculated value (always output); ◙ Sometimes input, sometimes output
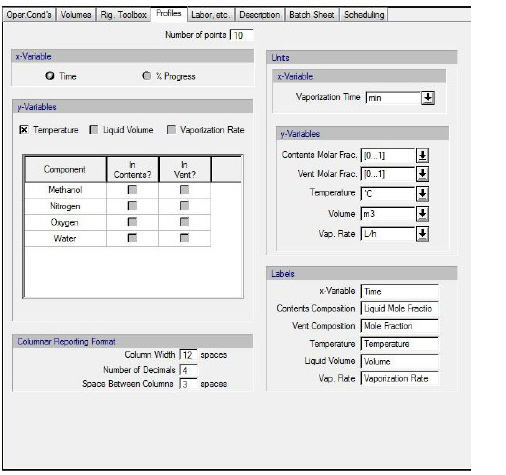
Through this tab the user identifies the variables that will be recorded as a function of time or % vaporization progress. In addition, the user can specify the number of recorded data sets and select the units of recorded variables.
The recorded data sets can be viewed in tabular format by right-clicking on the procedure’s icon and selecting Dynamic Data Records } <operation name> } View Recorded Data as a Table (see figure below). The recorded data sets can be saved in a file in ASCII or Excel (tab-delimited ASCII) format. Then, the plotting capabilities of Excel (or some other plotting software package) can be used to display the data graphically
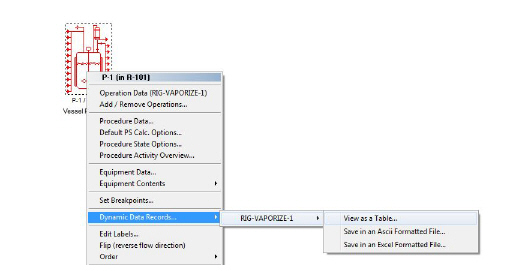
.
The Dynamic Data Records drop-down menu that is displayed when the user right-clicks on a procedure that hosts a batch reaction operation. The top line allows user to view the recorded data and the other two to save the recorded data in a formatted file.
|
|
In order to preserve certain formatting aspects in the display of the results (e.g., in Notepad), it is recommended that the Consolas or Lucida Console font should be employed. |
